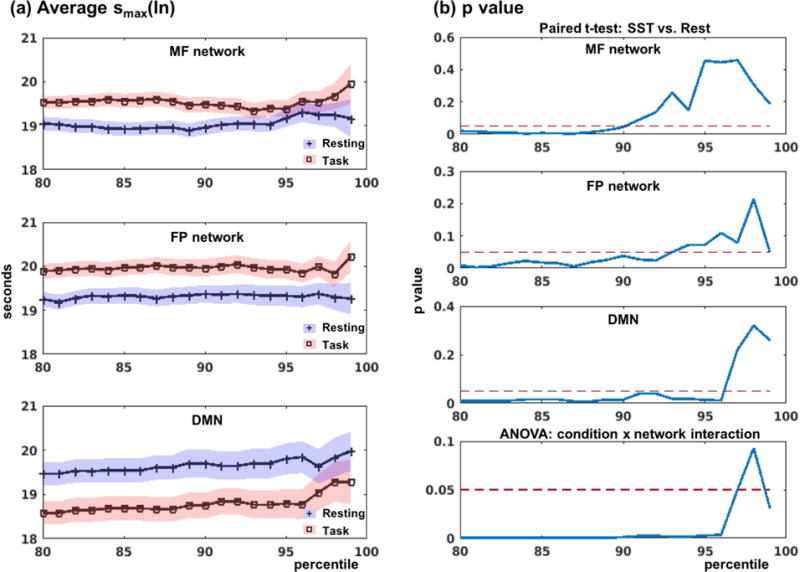
Figure 4.

Comparison of peak time scales of within network connectivity or smax(In). (a) Average smax for resting and task conditions within MF, FP and DMN. Blue and red shades represent the standard error of the mean for resting and task conditions, respectively. (b) Paired t-test (task vs. rest) results for each network, and the interaction effects (two-way ANOVA: task vs. rest × MF+FP vs. DMN).
