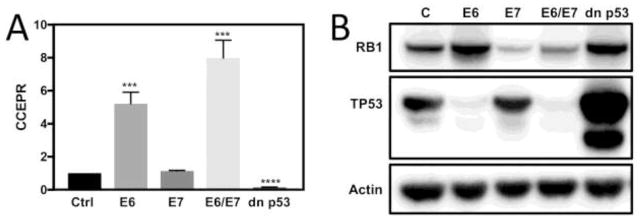
Figure 1.
CCEPR levels as determined by qRT-PCR in HFKs with stable co-expression of HPV16 E6/E7, individual expression of HPV16 E7, HPV16 E6 or a dominant negative TP53 minigene (dnp53) (A). Results are expressed relative to control vector transduced HFKs (Ctrl). Means ± SEM calculated from a single representative HFKs population, each performed in triplicate are shown. *** p<0.001 (Student’s t test). Validation of HPV16 E6 and/or E7 and dn p53 expression in HFKs by western blot analysis of RB1 and TP53. Actin is shown as a loading control (B).

