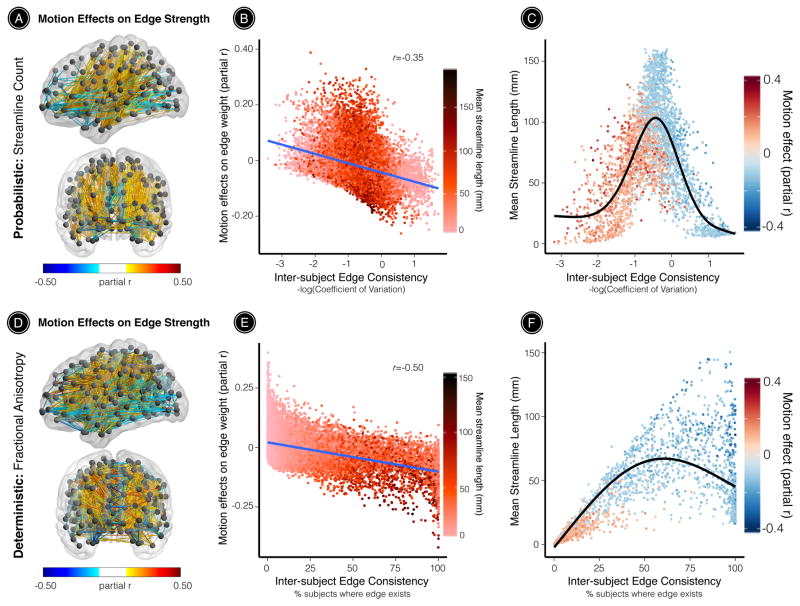
Figure 2. Motion effects on structural connectivity are driven by inter-subject edge consistency and streamline length.
The effect of in-scanner head motion on structural connectivity was estimated using a partial correlation for each network edge while controlling for age, age2, and sex. (A) When edge weights were defined by the number of probabilistic streamlines connecting a node pair, 12% of all network edges were significantly impacted by motion. (B) The direction and strength of motion effects were significantly correlated with inter-subject edge consistency (r=-0.35) and with mean streamline length (r=-0.21; see Supplementary Figure 1). (C) Inter-subject edge consistency exhibited a quadratic relationship with mean streamline length. Head motion significantly enhanced the strength of relatively short-range, low-consistency network edges. Further, head motion diminished the strength of relatively high-consistency network edges, which included both short- and long-range connections. (D) When edge weights were defined by the average FA along deterministic streamlines connecting a node pair, 14% of all network edges were significantly impacted by motion. (E) The direction and strength of motion effects were significantly associated with inter-subject edge consistency (r=-0.50) and with mean streamline length (r=-0.48; see also Supplementary Figure 1). (F) For networks derived from deterministic tractography, inter-subject edge consistency exhibited a parabolic relationship with mean streamline length. In agreement with results from probabilistic tractography, head motion significantly enhanced the strength of relatively short-range, low-consistency network edges, and diminished the strength of relatively long-range, high-consistency network edges. All statistical inferences were adjusted for multiple comparisons using FDR (Q < 0.05). The significance of all third-level correlations was evaluated using 10,000 permutations (permutation-based p < 0.0001). Black line in panels C and F represents the best fit from a general additive model with a penalized spline.

