
Figure 11.
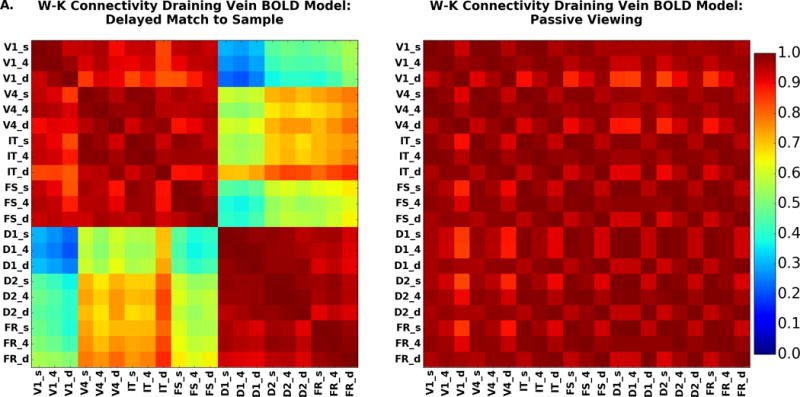
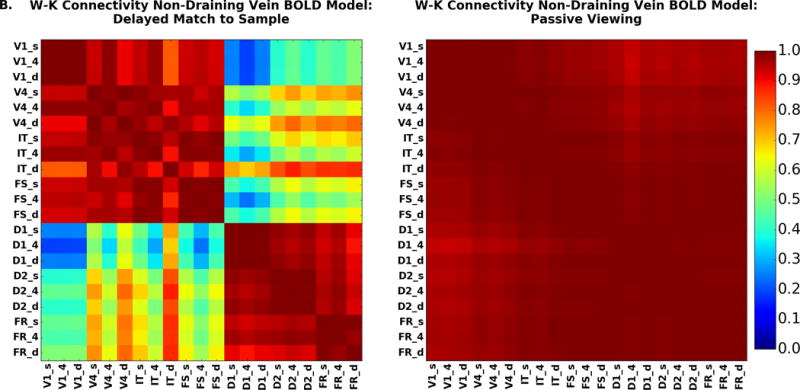
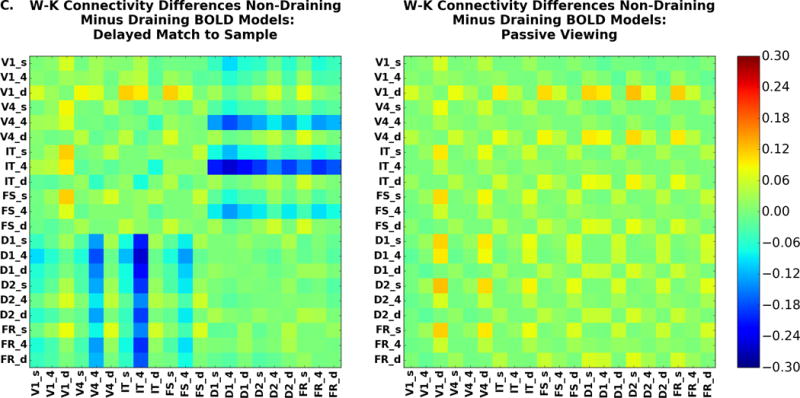
Laminar functional connectivity (fMRI timeseries correlations) for the DMS task (left) and PV (right). These show similar patterns to the reduced WK connectivity matrices on the right-hand side of Figure 8. Here we see the same divisions in the DMS task matrix. (A) Hemodynamic model included draining vein component; (B) hemodynamic model excluded draining vein component; (C) Non-draining vein minus draining vein models. The color bar indicates the value of the correlation coefficient.