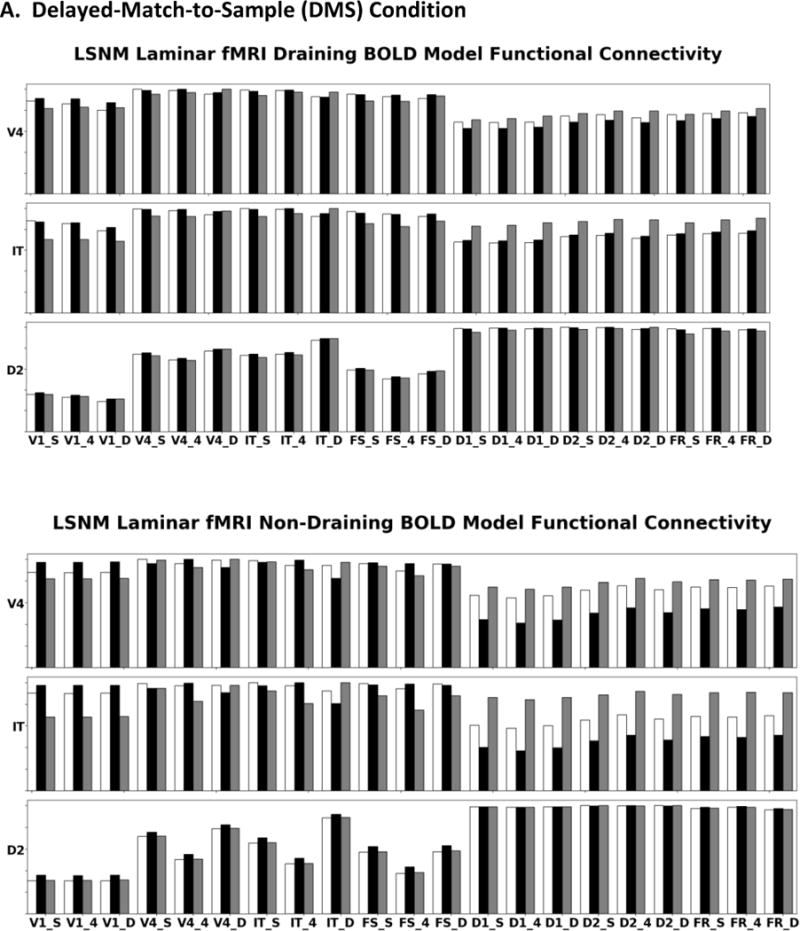
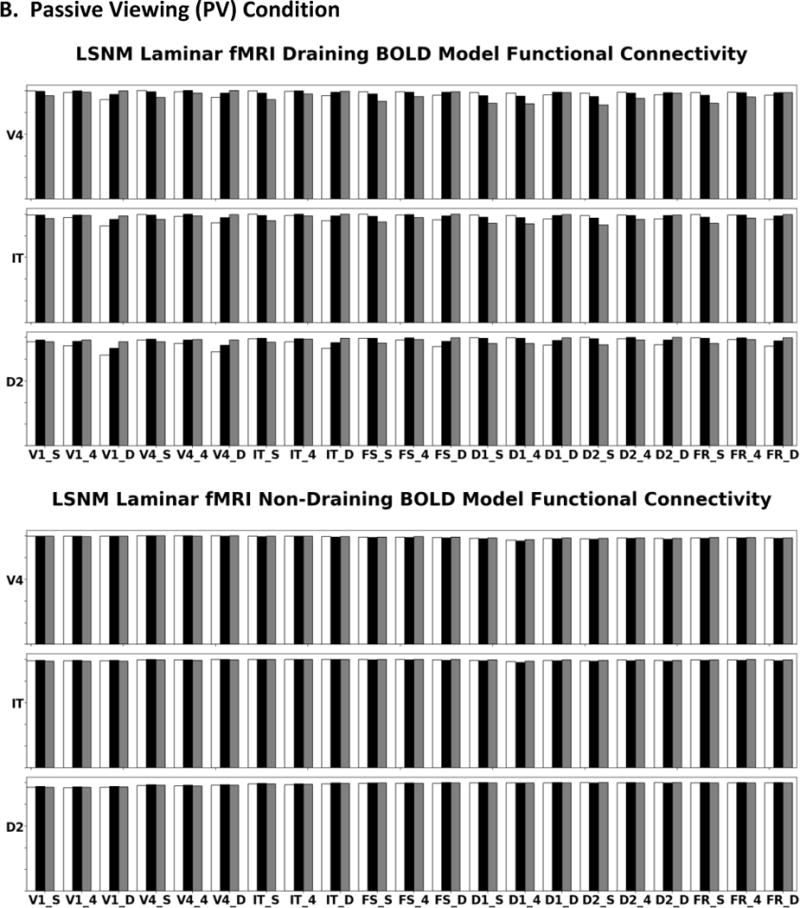
Figure 12.


(A) These bar graphs display simulated fMRI functional connectivity (i.e., correlation value) in specific regions during the DMS task for the draining (top panels) and non-draining vein hemodynamic model (bottom panels); this is the full laminar analysis of the connectivity for target regions V4, IT, and D2. As seen, the presence of draining veins attenuates the strengths of the neural functional connectivities. Feedforward connections from a particular region are inferred as showing the largest connectivity with the target region’s layer 4. Feedback and lateral connections are inferred when the region shows its greatest connectivity with the target region’s supragranular and infragranular layers. (B) Laminar functional connectivity for the PV condition for the draining (top panels) and non-draining vein hemodynamic model (bottom panels). White bars correspond to the region’s (denoted on the y-axis) supragranular layer, black bars to layer 4, and gray bars to infragranular layer. The y-axis goes from 0 to 1.
