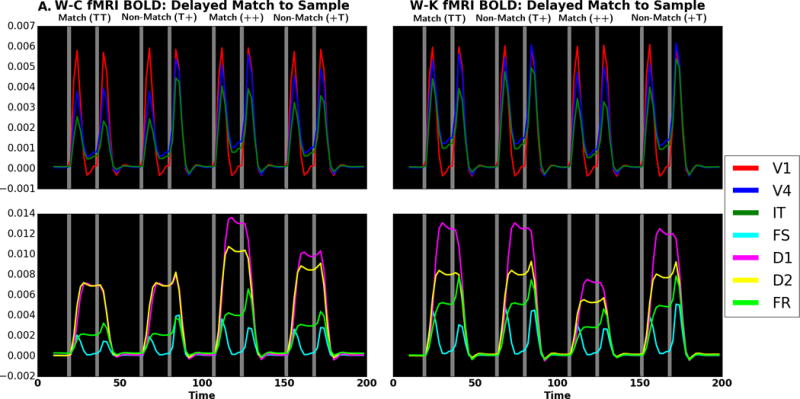
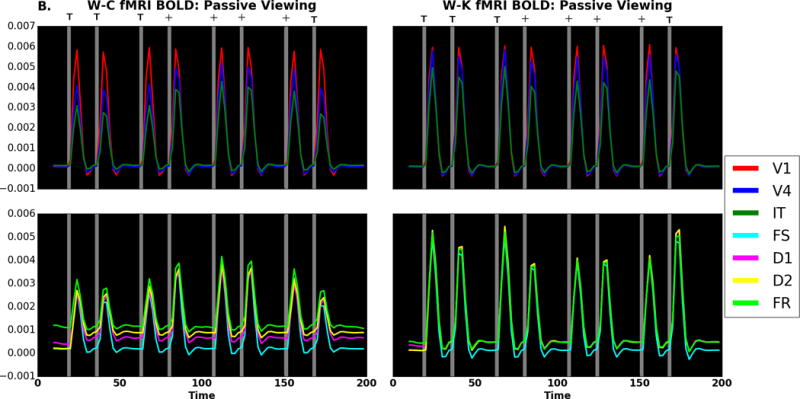
Figure 7.


fMRI fractional signal change comparing W-C (left) to W-K (right) for (A) DMS task and (B) passive viewing. Gray areas represent when a stimulus is present. There are four trials: match (TT), non-match (T+), match (++), and non-match (+T). Red corresponds to V1, blue to V4 and green to IT in the top and third rows; in the second and fourth rows, violet corresponds to D1, yellow to D2, cyan to FS and lime to FR. Note that if a color does not appear, it is because it has been overwritten by one of the others. The x-axis is time (in seconds), and the y-axis is activity level (fractional signal change relative to baseline).
