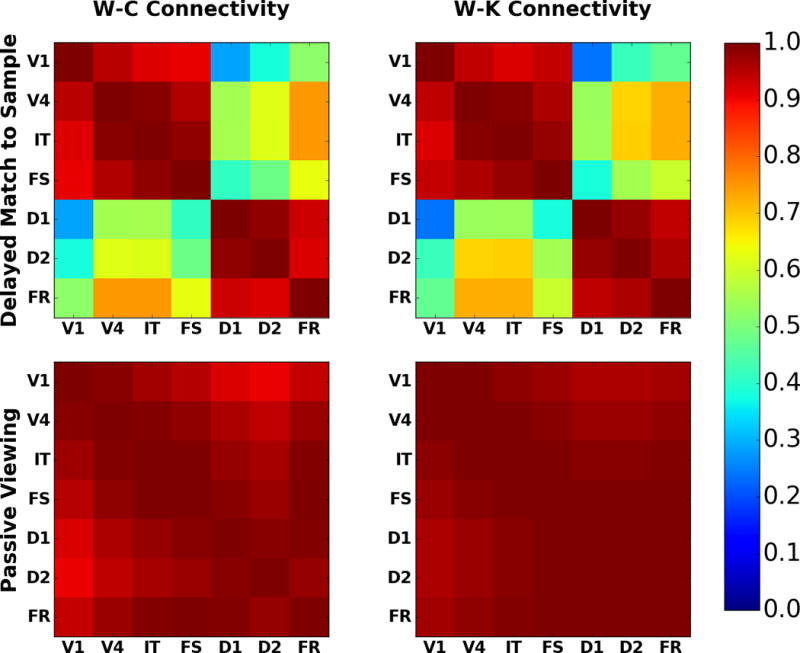
Figure 8.

Comparison of fMRI BOLD functional connectivity for W-C (left) and W-K (right) models; DMS task (top) and PV (bottom). These are the correlation matrices for each regional time series with the other regional time series. Note how the DMS connectivity matrices can be split into two blocks: a stimulus response block (upper left) and a working memory block (lower right). The PV matrices show that all regions are responding to the presence or absence of a stimulus. The color bar indicates the value of the correlation coefficient.
