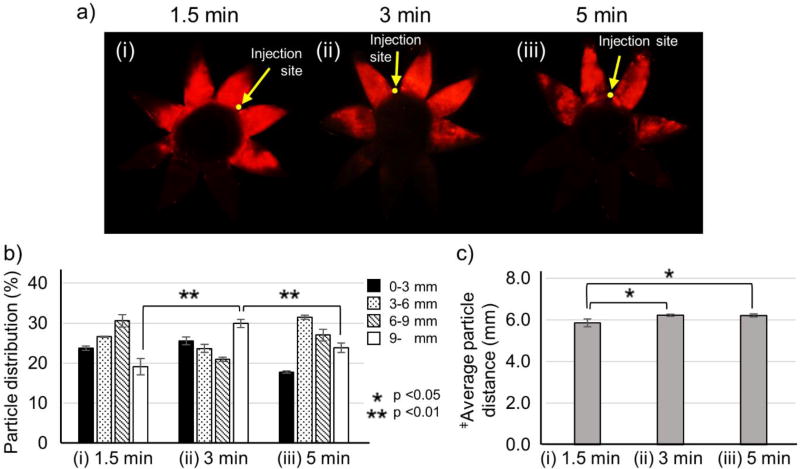
Figure 4.
Effect of iontophoresis application time after injection of nanoparticles in the suprachoroidal space (SCS). Representative fluorescence micrographs (a), distribution of red-fluorescent nanoparticles in the SCS (b), average distance of nanoparticle transfer in the SCS (c) due to iontophoresis at 0.14 mA for (i) 1.5 min, (ii) 3 min, and (iii) 5 min after injection of 200 µL of nanoparticles in HBSS into the SCS of rabbit eyes ex vivo. Fluorescence micrographs (a) show representative flat mounts of the eye after dissection with radial cuts from the posterior pole to the limbus. Yellow arrows point to sites of injection into the SCS. ‡Average particle distance (APD) (mm). Graphs (b and c) present average ± standard deviation based on 3 replicate samples.

