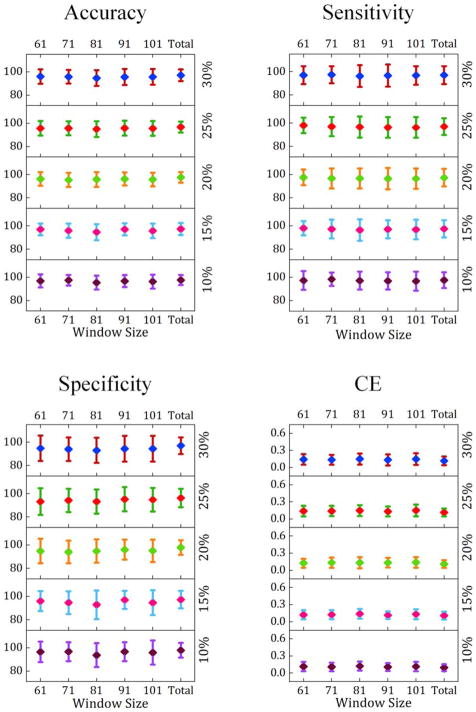
Fig. 3.
Prediction performance measures [mean with error bars reflecting ±SD across 100 validation folds] of the SVM model estimated for different window sizes and different connectivity density thresholds. The numbers on the left vertical axis of each figure illustrate the prediction performance values, and the numbers on the right side indicate connectivity density thresholding values.

