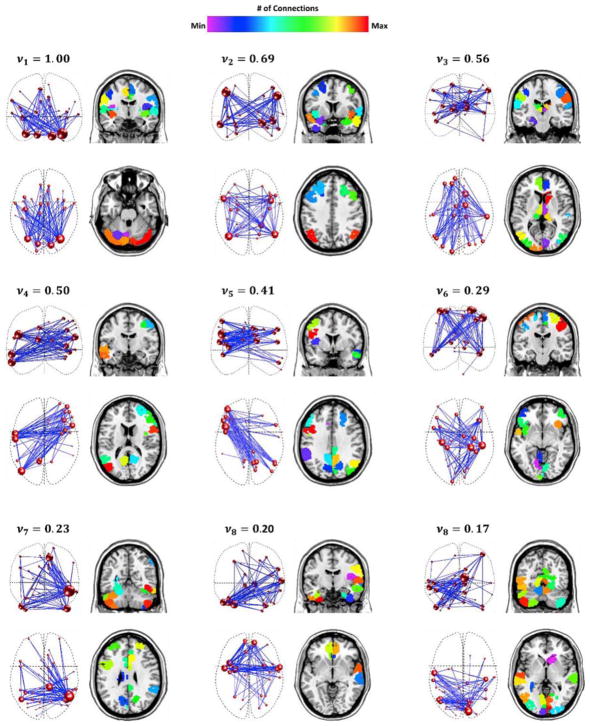
Fig. 4.
The connectivity principal components revealed by HOSVD. For each component, the left column displays a network-based representation and the right column shows the individual nodes in their anatomical locations. Each network component is a collection of nodes and edges that captures the greatest amount of variance across time and within individuals. The size of each node is directly related to its number of connections. The variance explained by each component, vi, where i indicates the component index, is noted on the top of the same component’s graph. For each component, the variance was computed as the square of the corresponding singular value normalized by the first singular value, that was finally averaged across 100 validation folds.

