Abstract
Rose cultivars with blue flower color are among the most attractive breeding targets in floriculture. However, they are difficult to produce due to the low efficiency of transformation systems, interactive effects of hosts and vectors, and lengthy processes. In this study, agroinfiltration-mediated transient expression was investigated as a tool to assess the function of flower color genes and to determine appropriate host cultivars for stable transformation in Rosa hybrida. To induce delphinidin accumulation and consequently to produce blue hue, the petals of 30 rose cultivars were infiltrated with three different expression vectors namely pBIH-35S-CcF3′5′H, pBIH-35S-Del2 and pBIH-35S-Del8, harbouring different sets of flower color genes. The results obtained showed that the ectopic expression of the genes was only detected in three cultivars with dark pink petals (i.e. ‘Purple power’, ‘High & Mora’ and ‘Marina’) after 6–8 days. The high performance liquid chromatography analyses confirmed delphinidin accumulation in the infiltrated petals caused by transient expression of CcF3′5′H gene. Moreover, there were significant differences in the amounts of delphinidin among the three cultivars infiltrated with the three different expression vectors. More specifically, the highest delphinidin content was detected in the cultivar ‘Purple power’ (4.67 µg g−1 FW), infiltrated with the pBIH-35S-Del2 vector. The expression of CcF3′5′H gene in the infiltrated petals was also confirmed by real time PCR. In conclusion and based on the findings of the present study, the agroinfiltration could be regarded as a reliable method to identify suitable rose cultivars in blue rose flower production programs.
Keywords: Agroinfiltration, Delphinidin, Expression vectors, Cultivar, Rosa hybrida
Introduction
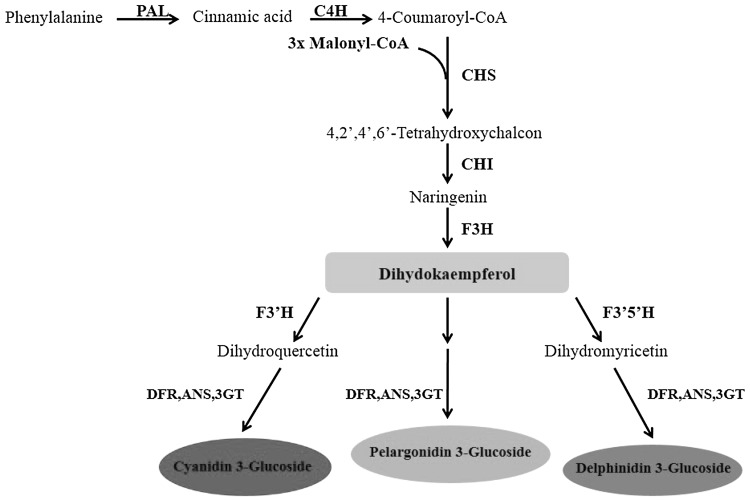
Flower color has always been of great interest from both floricultural and marketing point of views (Katsumoto et al. 2007). Cyanidin, delphinidin and pelargonidin are major anthocyanidins considered responsible for various flower colors (Fig. 1). These compounds possess a different number of hydroxyl groups at their B-ring and as a result, the natural or artificial modification of the B-ring by hydroxylation could lead to changes in flower color. Flavonoid 3′- hydroxylase (F3′H) and flavonoid 3′5′ hydroxylase (F3′5′H), which are P450 enzymes, catalyze hydroxylation of the anthocyanin B-ring. The main substrates for B-ring hydroxylation are naringenin and dihydrokaempferol (DHK) (Forkmann and Martens 2001). More specifically, the enzymes coded by the F3′H and F3′5′H genes convert DHK to dihydroquercetin and dihydromyricetin intermediates, respectively. Then, dihydroflavonol 4-reductase (DFR) catalyzes the reduction of the produced intermediates to cyanidin and delphinidin based anthocyanins, respectively (Holton and Cornish 1995; Tanaka 2006; Nishihara and Nakatsuka 2010).
Fig. 1.
The biosynthesis pathway for anthocyanidin. CHS, chalcone synthase; CHI, chalcone isomerase; F3H, flavanone 3-hydroxylase; F3′H, flavonoid 3′- hydroxylase; F3′5′H, flavonid 3′5′hydroxylase; DFR, dihydroflavonol 4-reductase; ANS, anthocyanidin synthase; 3GT, 3-glucosyl transferase.
Adapted from Katsumoto et al. (2007)
There are various naturally-occurring flower colors in the plant kingdom while some important colors have never been observed in certain plants such as violet/blue colors in roses. This has been attributed to the absence of F3′5′H and consequently its product i.e. delphinidin-based anthocyanins (Tanaka 2006). Conventional rose breeding programs used to modify flower colors have been found inefficient for developing blue color in roses because of the lack of required genes. Hence in the year 2007, genetic manipulation was employed for the first time to produce transgenic blue roses (Katsumoto et al. 2007). Since then, efforts aimed at improving flower colors by genetic engineering in plants have been intensified. However, the main setback faced has been the considerable time required for generating stable transgenic plants (Azadi et al. 2010; Kuriakose et al. 2012). To overcome this challenge and to facilitate the selection of a range of suitable genotypes for mainstream transformation, analyses of flavonoid composition using high-performance liquid chromatography (HPLC) was suggested (Katsumoto et al. 2007; Brugliera et al. 2013). However, this method is not sufficiently rapid and only provides a range of suitable genotypes for transformation rather than specifically determining them. Therefore, the present study was set to use agroinfiltration in evaluating flower color gene functions in order to identify suitable cultivars for generating blue rose flowers. More specifically, transient expression induced by agroinfiltration was performed by visual observations in a very short time while requiring minimum facilities.
Materials and methods
Plant material
Thirty cultivars of Rosa hybrida L. with different flower colors (white, yellow, orange, red and pink) were selected. One day prior to agroinfiltration, the newly blossomed flowers were collected from the greenhouse according to Yasmin and Debener (2010). The flowers were maintained in 1 l distilled water containing 2.5 g sucrose and 1 teaspoon of bleach (5% hypochlorite sodium). In order to maintain the quality of the rose flowers, they were stored in a growth chamber at 22 ± 1 °C (Kuriakose et al. 2012).
Agrobacterium strain and the genetic constructs
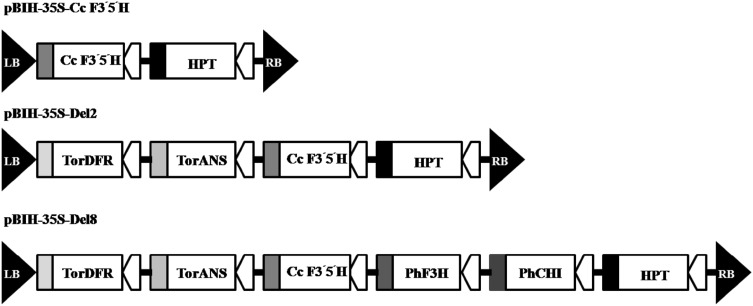
The Agrobacterium strain EHA101 harboring three different expression vectors including pBIH-35S-Cc F3′5′H (containing Commelina communis F3′5′H), pBIH-35S-Del2 (containing C. communis F3′5′H, Torenia fournieri DFR and ANS) and pBIH-35S-Del8 (containing C. communis F3′5′H, Torenia fournieri DFR and ANS, PhalaenopsisamabilisF3H and CHI) was used in this study. All flower color genes were driven by cauliflower mosaic virus CaMV35S promoter and CaMV35S terminator. All three vectors carried hygromycin phosphotransferase (hpt) gene under the enhanced CaMV35S promoter and NOS terminator as a selectable marker (Fig. 2) (Yuki et al. 2013).
Fig. 2.
Schematic of T-DNA structure of the interested binary vectors used for transient expression. The vectors contain the hygromycin phosphotransferas (hpt) as the selection marker and under the enhanced cauliflower mosaic virus (CaMV) 35S promoter and NOS terminator. a pBIH-35S-Cc F3′5′H binary vectors harboring Commelina communis F3′5′H. b pBIH-35S-Del2 binary vectors harboring C. communis F3′5′H, Torenia fournieri DFR, and c pBIH-35S-Del8 binary vectors harboring C. communis F3′5′H, Torenia fournieri DFR and ANS, Phalaenopsis amabilis F3H and CHI. All genes are under the control of CaMV35S promoter and CaMV35S terminator
Preparation of Agrobacterium
Agrobacterium was cultivated overnight in YEP liquid medium (10 gl−1 bacto tryptone, 10 gl−1 yeast extract and 5 gl−1NaCl, pH7.2) supplemented with specific antibiotics (25 mgl−1 chloramphenicol and 50 mgl−1hygromycin) at 28 °C and 180 rpm (Wroblewski et al. 2005). Overnight cultured bacteria were pelleted by centrifugation at 3000 rpm at 22 °C for 10 min. The pellets were washed once with the infiltration buffer (5 gl−1 d-glucose, 500 mM 2-(N-morpholino) ethane sulfonic acid (MES) and 50 mM Na2HPO4, pH 5) according to the modified method of Sparkes et al. (2006). The bacterial suspension (5 ml) was diluted with infiltration buffer to a final OD600 of 0.5. The bacterial suspension was then injected into the adaxial side of the middle sector of the undetached petals. The injections were carried out using a 2 ml needleless syringe (Yasmin and Debener 2010). The infiltrated petals were kept in the growth chamber (22 ± 1 °C) in dark conditions for 8 days. The petals were finally frozen in liquid nitrogen and stored at – 80 °C until further analysis.
HPLC analysis
Following the color change of the petals into dark pink after agroinfiltration, 4 cultivars were selected for HPLC analyses including ‘Gulmira’, ‘High & Mora’, ‘Marina’ and ‘Purple power’. For anthocyanin compounds analyses, frozen petals were ground to a fine powder using liquid nitrogen. For each sample, 1 g of the petals was used for extraction with 1 ml methanol containing 1% HCl (v/v) (Nakatsuka et al. 2007). Following the extraction, the samples were centrifuged at 12000 rpm for 7 min. Then, 4.5 ml 3MHCl was added to each supernatant and the extracts were hydrolyzed by boiling for 90 min. The hydrolyzed solutions were then extracted twice in 1 ml pentanol solution. The pentanol fractions were then evaporated and the remainings was re-dissolved in 500 µl methanol containing 0.1% HCl (v/v). HPLC analyses were performed using a Knauer HPLC (USA) equipped with a spheri 80 ODS2, i.d. 4 μm column at 40 °C with a diode array detector at 530 nm as described by Durst and Wrolstad (2001). The injection volume was 20 µl and the flow rate was maintained at 1 ml/min. Solvent A (acetonitrile) and Solvent B (10% acetic acid, % 5 acetonitrile and 1% phosphoric acid in water) were used. Delphinidin chloride, cyanidin chloride and pelargonidin chloride standards were purchased from Extrasynthese (Genay, France).
Real-time PCR analysis
Total RNA was extracted from the ‘Purple power’ petals infiltrated with the pBIH-35S-Cc F3′5′H and pBIH-35S-Del2 vectors using the method previously described by Morante-Carriel et al. (2014). The extracted total RNA was quantified at 230, 260, and 280 nm (A260/A230 and A260/A280 ratios) with a Nano drop 1000 (Thermo Scientific). The integrity of total RNA was verified by running samples on a 1% agarose gel. Single-stranded cDNA was synthesized using 1 μg of the total RNA extracted using the Quantitect following the manufacturer’s instructions (Reverse Transcription Kit, Qiagen). cDNA was then quantified using the Nano Drop 1000.
Real-time PCR was carried out by a iCycleriQrealtime-PCR (BioRaD) system using the iQ™Syber Green Supermix (BioRaD) in accordance with the recommendations of the manufacturer. Reaction mixtures (20 μl) contained 10 μl of SYBR-Green, 1 μl of forward and reverse primers (10 μM), 2 μl of cDNA and 6 μl of DEPC water. The amplification procedure performed included a denaturation step at 95 °C for 5 min, followed by 45 cycles (60 s at 95 °C, 30 s at 59 °C and 60 s at 72 °C) and a final extension step at 72 °C for 10 min. The 18S rRNA gene was used as an internal control for normalization. Cycle threshold values were recorded for both agroinfiltrated samples and reference gene for further analysis and the data obtained were analyzed by the REST Software version 2002. The relative expression of the detected genes was calculated using the relative 2−∆∆CT method (Schmittgen and Livak 2008). The primers used for real-time PCR are listed in Table 1.
Table 1.
Gene-specific primer pairs used for real-time PCR
| Gene | Primer pairs | Sequence (5′-3′) | Amplicon size |
|---|---|---|---|
| CcF3′5′H | Forward primer | CCCATTATGCACCTTCGACT | 120 bp |
| Reverse primer | ACGGTCCCGAAAGAAGTTTT | ||
| 18S | Forward primer | ATGATAACTCGACGGATCGCA | 169 bp |
| Reverse primer | CTTGGATGTGGTAGCCGTTTC |
Microscopic observation of petal epidermal cells
The blue colored parts of the injected petal were cut and immersed in a 0.25% polyethylene glycol (w/v) (PEG) to plasmolyze epidermal cells for a better view of the vacuole (Mudalige et al. 2003). The epidermis of the blue-colored parts were peeled with a razor blade and visualized under a light microscope (Zeiss, Axiostar Plus, Germany).
Statistical analysis
All the data obtained were analyzed using the ANOVA. The experimental design used was a completely randomized design based on a factorial arrangement with 3 replications. Means were compared using the Duncan’s multiple range test at the 1% probability level (P ≤ 0.01). All computations were conducted using the SAS statistical analysis package (SAS Inc., Cary, NC, USA). All data were checked for normal distribution and were subjected to √Y + 1 transformation before statistical analysis.
Results
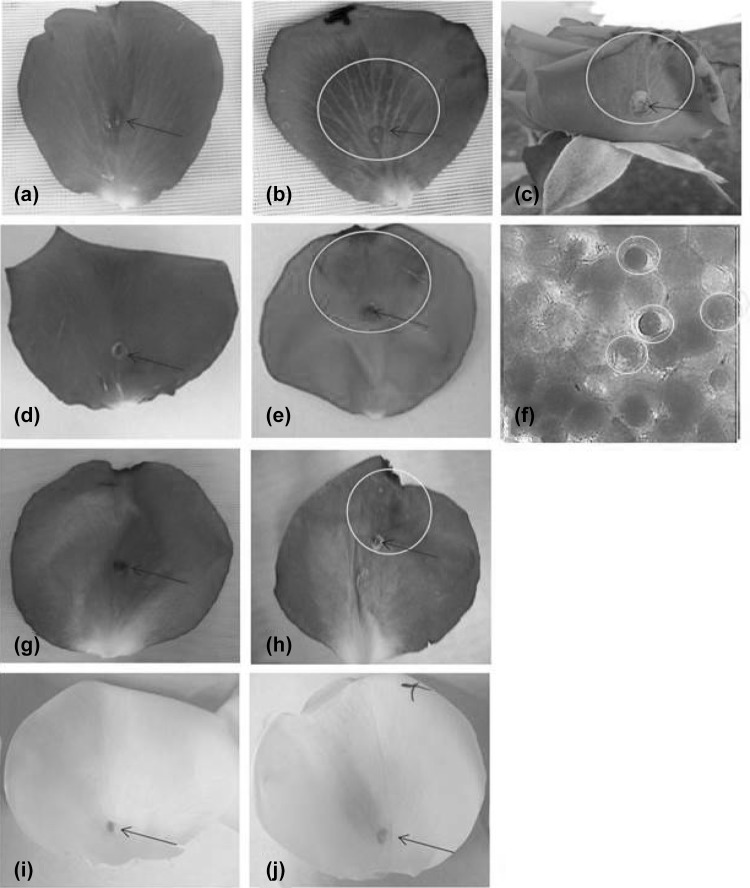
Among the 30 cultivars subjected to agroinfiltration using the three different constructs, only three cultivars including Rosa hybrida cv. ‘Purple power’, ‘High & Mora’ and ‘Marina’, showed the blue color, 6–8 days after the infiltration. The original petal color in all these cultivars was dark pink. Figure 3a, d, g, i show the petals of the ‘Purple Power’, ‘High & Mora’, ‘Marina’ and ‘Gulmira’ cultivars respectively treated by buffer as control while Fig. 3b, e, h illustrate the petals of ‘Purple Power’, ‘High & Mora’ and ‘Marina’ in blue color respectively after they were infiltrated by Agrobacterium carrying the pBIH-35S-Del2 construct. The microscopic study of the epidermal cells of ‘High & Mora’ revealed the emergence of the blue cells on the adaxial surface (Fig. 3f). The white flower ‘Gulmira’ which was also used as the control plant showed no blue color after the infiltration with the three constructs for it lacked the precursors required for blue color development (Fig. 3j).
Fig. 3.
Petals of Rosa hybrida cv. ‘Purple Power’, ‘High &Mora’, ‘Marina’ and ‘Gulmira’ treated by agroinfilteration: a, d, g, i ‘Purple Power’, ‘High & Mora’, ‘Marina’ and ‘Gulmira’ infiltrated by buffer (control), respectively. b, e, h, j ‘Purple Power’, ‘High & Mora’, ‘Marina’ and ‘Gulmira’ infiltrated by Agrobacterium carrying a pBIH-35S-Del2 construct, respectively. c ‘Purple Power’ flower infiltrated by Agrobacterium carrying a pBIH-35S-Del2 construct. f Epidermal cell of ‘High & Mora’ after agroinfiltraion with pBIH-35S-Del2 by Zeiss light microscope. Note: mauve color pigments on adaxial side of the epidermis cell (bar = 100 µm) and on petals are represented by yellow circle. Agrobacterium injected sites using 2 ml needleless syringe are represented by black arrow (color figure online)
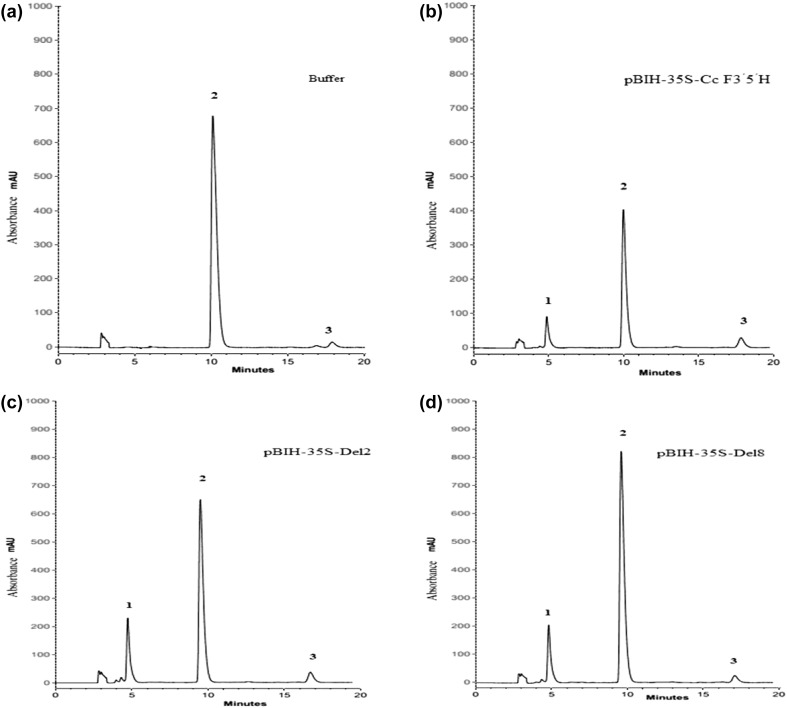
The anthocyanin contents of the petals injected with the three constructs or the buffer (as control) were determined using HPLC. Figure 4 presents the HPLC chromatograms of the methanolic extracts obtained from the infiltrated ‘Purple power’ petals. The three peaks at 530 nm, correspond to delphinidin, cyanidin and pelargonidin-based anthocyanin. Figure 4a illustrates the peaks associated with cyanidin and pelargonidinin in the buffer-treated control petals and Fig. 4b–d shows the delphinidin, cyanidin and pelargonidin peaks in the Agrobacterium infiltrated petals treated with the pBIH-35S-Cc F3′5′H, pBIH-35S-Del2 and pBIH-35S-Del8 vectors, respectively.
Fig. 4.
HPLC profiles of the infiltrated petals of R x hybrida cv. ‘Purple power’. a Buffer treated petals as control. b The infiltrate petals treated by Agrobacterium carrying the pBIH-35S-Cc F3′5′Hvector. c The infiltrate petals treated by Agrobacterium carrying the pBIH-35S-Del2 vector. d The infiltrate petals treated by Agrobacterium carrying the pBIH-35S-Del8 vector, (Peak1: delphinidin, Peak2: cyanidin, Peak3: pelargonidin)
Table 2 tabulates the anthocyanidin composition (µg g−1 fresh weight) in the infiltrated petals of different rose cultivars. Delphinidin was not detected in the control petals (infiltrated with buffer) nor in the white petals of ‘Gulmira’. Moreover, delphinidin was not detected in petals of ‘High and Mora’ and ‘Gulmira’ infiltrated with agrobacterium empty vector (data not shown). On the contrary, in the cultivars ‘Purple power’, ‘High & Mora’ and ‘Marina’ infiltrated with the three constructs, delphinidin was present (Table 2). In fact, the transient expression of Cc F3′5′H must have caused a significant accumulation of delphinidin in the three mentioned cultivars. The greatest amount of delphinidin (4.67 µg g−1FW) was detected in the ‘Purple power’ cultivar when infiltrated by the pBIH-35S-Del2 construct (Table 2).
Table 2.
Anthocyanidin composition in the infiltrated petals of different Rosa hybrida cultivars (µg g−1 fresh weight)
| Cultivar (flower color) | Agrobacterium construct | Cyanidina (µg g−1 FW) | Pelargonidina (µg g−1 FW) | Delphinidina (µg g−1 FW) |
|---|---|---|---|---|
| ‘Purple Power’ (dark pink) | Control | 966.4 ± 585.91ab | 107.26 ± 299.20ab | n.d.f |
| pBIH-35S-CcF3′5′H | 577.7 ± 295.50dc | 56.47 ± 1.53dc | 2.55 ± 0.22bc | |
| pBIH-35S-Del2 | 681.4 ± 308.94dc | 32.00 ± 3.83e | 4.67 ± 0.79a | |
| pBIH-35S-Del8 | 1098.30 ± 103.83a | 107.12 ± 32.73ab | 3.25 ± 0.12ab | |
| ‘High & Mora’ (dark pink) | Control | 948.3 ± 104.53ab | 116.80 ± 29.82a | n.d.f |
| pBIH-35S-CcF3′5′H | 514.6 ± 393.30dce | 77.46 ± 5.14bc | 1.63 ± 0.67dc | |
| pBIH-35S-Del2 | 384.3 ± 89.93def | 7.53 ± 2.09 g | 1.70 ± 0.63dc | |
| pBIH-35S-Del8 | 614.3 ± 323.18dc | 90.48 ± 5.13ab | 1.34 ± 0.56d | |
| ‘Marina’ (dark pink) | Control | 247.7 ± 226.36f | 11.55 ± 1.71 fg | n.d.f |
| pBIH-35S-CcF3′5′H | 685.3 ± 148.02bc | 47.46 ± 2.27de | 0.98 ± 0.50de | |
| pBIH-35S-Del2 | 317.8 ± 204.36ef | 11.48 ± 3.42 fg | 0.07 ± 0.07f | |
| pBIH-35S-Del8 | 730.6 ± 298.19bc | 23.13 ± 1.24ef | 0.19 ± 0.09ef | |
| ‘Gulmira’ (white) | Control | 3.00 ± 0.21 g | n.d.h | n.d.f |
| pBIH-35S-CcF3′5′H | 2.20 ± 0.20 g | n.d.h | n.d.f | |
| pBIH-35S-Del2 | 2.50 ± 0.11 g | n.d.h | n.d.f | |
| pBIH-35S-Del8 | 2.30 ± 0.18 g | n.d.h | n.d.f |
The values are the mean ± standard error of three replicates, Means with different letters are significantly different according to Duncan’s Multiple Range Test (p < 0.01)
The cyanidin and pelargonidin contents as the main anthocyanins varied among the infiltrated petals. Compared to both the buffer- and pBIH-35S-Del8-infiltrated petals, cyanidin concentration decreased in the petals of the ‘Purple power’ cultivar by 40.2 and 29.5%, when infiltrated with the pBIH-35S-Cc F3′5′H and pBIH-35S-Del2 constructs, respectively. Moreover, the pelargonidin content significantly decreased in the pBIH-35S-Cc F3′5′H and pBIH-35S-Del2 infiltrated ‘Purple power’ (by 47.4 and 70.2%, respectively), whereas almost equal amounts were detected in the pBIH-35S-Del8 and buffer infiltrated ones. The amount of delphinidin in ‘High & Mora’ (on average 1.55 µg g−1 FW) was not significantly influenced by using the three constructs. Moreover, the results obtained showed a clear reduction in cyanidin and pelargonidin contents in ‘High & Mora’ petals infiltrated with pBIH-35S-Cc F3′5′H (by 45.7 and 33.7%, respectively), pBIH-35S-Del2 (by 59.5 and 93.6%, respectively) and pBIH-35S-Del8 (by 35.2 and 80.2%, respectively) compared to the control (buffer). ‘Marina’ contained less delphinidin compared to the other cultivars. In ‘Marina’, the concentrations of cyanidin and pelargonidin influenced by the infiltration with pBIH-35S-Cc F3′5′H, pBIH-35S-Del2 and pBIH-35S-Del8 were more than those of the control (buffer). In all of the agroinfiltrated petals of ‘Gulmira’ treated with different constructs and buffer, only cyanidin was detected.
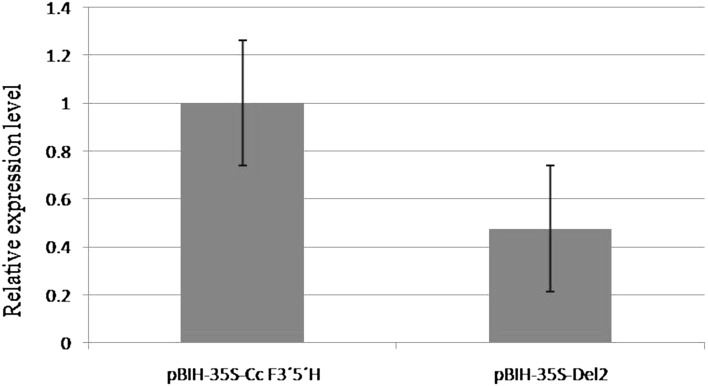
Statistical analysis of the data obtained from the quantitative Real-Time PCR showed that the agroinfiltration of the vectors pBIH-35S-Cc F3′5′H and pBIH-35S-Del2 led to the expression of Cc F3′5′H in ‘Purple power’ petals. The comparison of the expression level of Cc F3′5′H between the two vectors of pBIH-35S-Cc F3′5′H and pBIH-35S-Del2 revealed no significant differences as shown in Fig. 5. The results obtained through the molecular study were in line with those of the HPLC experiments.
Fig. 5.
Relative expression level of the CcF3′5′H gene in the infiltrated ‘Purple power’ petals treated by Agrobacterium carrying the pBIH-35S-Cc F3′5′H and pBIH-35S-Del2 vectors
Discussion
One of the main steps involved in changing the flower color through genetic engineering is the selection of an appropriate host cultivar that would be suitable for exclusive accumulation of delphinidin. The main criterion for the selection of such host cultivar to achieve blue color by delphinidin production is the innate presence of flavonols as co-pigments. On such basis and to identify the proper host cultivars possessing the essential characteristics, Brugliera et al. (2013) and Katsumoto et al. (2007) used the HPLC method and assessed the flavonoid composition in 75 and 169 cultivars of chrysanthemum and rose, respectively. Despite their novel approach, their method was not very effective in segregating the genotypes. They reported that after a stable transformation, only a few of the selected genotypes showed an appropriate response to flower color change.
In the year 2002, Borcke proposed the application of the transient expression technology in engineering a secondary metabolite pathway through over-expression of one enzyme in a pathway. Transient expression technology could be employed to identify the right host and vectors as proposed in the present study. Therefore, the present investigation for the first time presents a rapid and reliable method for selection of suitable rose cultivars to be used in blue flower production studies. More specifically, the innate presence of the biochemical base required for the production of desired colors in rose was identified using agroinfilteration. Our results revealed that color change to blue was only achievable in cultivars inherently producing dark pink flowers and cultivars with red, yellow, orange and white flowers did not show blue coloration. This was in agreement with the findings of Brugliera et al. (2013) who demonstrated that color change success was cultivar–specific and therefore, cultivar-specific strategies were required as well.
Flower pigmentation is due to the accumulation of plant secondary metabolites such as anthocyanins within the vacuoles of epidermal cells (Tanaka et al. 2005). In the present study, the transient expression of pBIH-35S-Del2 resulted in a phenotypic change from pink to mauve in the epidermal cells of some rose cultivars. Qi et al. (2013) previously reported similar results in oriental lily ‘Sorbonne’ by the transient expression of PhF3′5′H.
A great deal of effort has been made with the aim of changing the flower color of roses (Tanaka et al. 2009; Katsumoto et al. 2007; Gutterson 1995), but many failed to achieve the targets set forth due to the interactive effects of hosts and vectors. For instance, in a study by Tanaka et al. (2009), the expression of F3′5′H gene from petunia, gentian or butterfly pea in rose resulted in no or little delphinidin accumulation in the petals of transgenic plants, even though these genes were shown to be functional in petunia, carnation and yeast. Moreover, roses are recalcitrant plants, and stable transformation will be both time consuming and costly. In order to improve blue gene technology, researchers have suggested that the efficiency of different F3′5′H proteins for direct production of delphinidin precursors need to be analyzed (Davies 2009). In a study, Shimada et al. (2003) showed that the F3′5′H transgene taken from Canterbury bells (Campanula medium) generated a higher level of delphinidin in tobacco than those of petunia or lisianthus.
Of the three constructs and 30 host cultivars used in the present study, the multi-gene construct pBIH-35S-Del2 in the cultivar ‘Purple power’ showed the most suitable combination for the transformation purposes. In a study by Nakatsuka et al. (2007), in which multi-gene cassettes were used as well, synchronous expression of Torenia fournieri DFR, Torenia fournieriANS (anthocyanin synthesis) and CcF3′5′H produced more delphinidin than the Cc F3′5′H alone. They also stated that the substrate specificity of DFR enzymes was one of the most important agents in the formation of the three pigment types (i.e. cyanidin, pelargonidin and delphinidin).
The construct used in this study i.e. pBIH-35S-Del2 contain Cc F3′5′H, DFR and ANS. It appears that the expression of these three genes must have led to the generation of dihydromyricetin (DHM) and reduction of pelargonidin and cyanidin precursors. This was in line with the findings of the previous studies in which more significant accumulation of delphinidin was observed when the two related genes of F3′5′H and DFR were co-expressed in carnation, rose and petunia (Katsumoto et al. 2007; Qi et al. 2013). Moreover, to obtain a more significant accumulation of delphinidin in rose, Katsumoto et al. (2007) performed simultaneous over expression of the viola F3′5′H transgene and the iris DFR transgene combined with down-regulation of the rose DFR gene. Tanaka et al. (1998) reported the option of the gene source as an important factor to be considered in genetic engineering, due to the difficulties associated with gene transformation, the competing endogenous gene, and the intracellular condition.
In the present study, the expression analysis of the Cc F3′5′H gene with different vectors after transient transformation was conducted by real time PCR. This method is very sensitive in detecting gene expression allowing the quantification of relative expression and is more amenable to biological replication and statistical analysis (Moriwaki et al. 1999). The results obtained indicated successful gene delivery and transient expression in the rose petals. Although no differences were observed among the applied vectors in the present study, the expression level of Cc F3′5′H confirmed the suitability of agroinfiltration in studying the function of genes involved in petal color change.
Conclusion
In order to induce blue hue in rose flowers, the petals of 30 rose cultivars were infiltrated with three different expression vectors (i.e. pBIH-35S-Cc F3′5′H, pBIH-35S-Del2 and pBIH-35S-Del8), harbouring different sets of flower color genes. The results confirmed that agroinfiltration was a rapid and effective method in evaluating the function of genes involved in flower color change and that it could assist with the identification of the most suitable host cultivars for blue flower production in roses.
Acknowledgements
This work was supported by Agricultural Biotechnology Research Institute of Iran (ABRII). M Zeini Pour did the project as part of her PhD thesis.
Conflicts of interest
The authors declare that there are no conflicts of interest.
Contributor Information
Pejman Azadi, Email: azadip@abrii.ac.ir, Email: azadip22@gmail.com.
Masahiro Mii, Email: miim@faculty.chiba-u.jp.
References
- Azadi P, Ntui VO, Chin DP, Nakamura I, Fujisawa M, Harada H, Misawa N, Mii M. Metabolic engineering of Lilium×formolongi using multiple genes of the carotenoid biosynthesis pathway. Plant Biotech Rep. 2010;4:269–280. doi: 10.1007/s11816-010-0147-y. [DOI] [Google Scholar]
- Borcke LV (2002) High efficiency transient expression system for plants. Patent Publication Number WO 01/038512
- Brugliera F, Tao GQ, Tems U, Kalc G, Mouradova E, Price K, Stevenson K, Nakamura N, Stacey I, Katsumoto Y, Tanaka Y, Mason JG. Violet/Blue chrysanthemums metabolic engineering of the anthocyanin biosynthetic pathway results in novel petal colors. Plant Cell Physiol. 2013;54:1696–1710. doi: 10.1093/pcp/pct110. [DOI] [PubMed] [Google Scholar]
- Davies KM, et al. Modifying anthocyanin production in flowers. In: Gould K, et al., editors. Anthocyanins. Berlin: Springer; 2009. [Google Scholar]
- Durst RW, Wrolstad RE. Separation and characterization of anthocyanins by HPLC. Unit F1.3.1–13. In: Wrolstad RE, editor. Current protocols in food analytical chemistry. New York: Wiley; 2001. pp. 49–83. [Google Scholar]
- Forkmann G, Martens S. Metabolic engineering and applications of flavonoids. Curr Opin Biotechnol. 2001;12:155–160. doi: 10.1016/S0958-1669(00)00192-0. [DOI] [PubMed] [Google Scholar]
- Gutterson N. Anthocyanin biosynthetic genes and their application to flower colour modification through sense suppression. Hort Sci. 1995;30:964–966. [Google Scholar]
- Holton TA, Cornish EC. Genetics and biochemistry of anthocyanin biosynthesis. Plant Cell. 1995;7:1071–1083. doi: 10.1105/tpc.7.7.1071. [DOI] [PMC free article] [PubMed] [Google Scholar]
- Katsumoto Y, Fukuchi-Mizutani M, Fukui Y, Bruglier F, Holton TA, Karan M, Nakamura N, Yonekura-Sakakibara K, Togam J, Pigeaire A, Ta GQ, Nehra NS, Lu CY, Dyson BK, Tsuda S, Ashikari T, Kusumi T, Mason JG, Tanaka Y. Engineering of the rose flavonoid biosynthetic pathway successfully generated blue-hued flowers accumulating delphinidin. Plant Cell Physiol. 2007;48:1589–1600. doi: 10.1093/pcp/pcm131. [DOI] [PubMed] [Google Scholar]
- Kuriakose B, Du Toit ES, Jordaan A. Transient gene expression assays in rose tissues using a Bio-Rad Helios hand-held gene gun. S Afr J Bot. 2012;78:307–311. doi: 10.1016/j.sajb.2011.06.002. [DOI] [Google Scholar]
- Morante-Carriel MJ, Marchart SS, Márquez MA, Esteso MMJ, Luque I, Martínez BR. RNA isolation from loquat and other recalcitrant woody plants with high quality and yield. Anal Biochem. 2014 doi: 10.1016/j.ab.2014.02.010. [DOI] [PubMed] [Google Scholar]
- Moriwaki M, Yamakawa T, Washino T, Kodama T, Igarashi Y. Organspecific expression of â-glucuronidase activity driven by the Arabidopsis heat-shock promoter in heat stressed transgenic tobacco and Arabidopsis plants. Plant Mol Biol. 1999;28:73–82. [Google Scholar]
- Mudalige RG, Kuehnle AR, Amore TD. Pigment distribution and epidermal cell shape in Dendrobium Speciec and hybrids. Hort Sci. 2003;38:573–577. [Google Scholar]
- Nakatsuka T, Abe Y, Kakizaki Y, Yamamura S, Nishihara M. Production of red-flowered plants by genetic engineering of multiple flavonoid biosynthetic genes. Plant Cell Rep. 2007;26:1951–1959. doi: 10.1007/s00299-007-0401-0. [DOI] [PubMed] [Google Scholar]
- Nishihara M, Nakatsuka T. Genetic engineering of novel flower colors in floricultural plants: recent advances via transgenic approaches. In: Jain SM, Ochatt SJ, editors. Protocols for in vitro propagation of ornamental plants. New York: Humana Press; 2010. pp. 325–347. [DOI] [PubMed] [Google Scholar]
- Qi Y, Lou Q, Quan Y, Liu Y, Wang Y. Flower-specific expression of the Phalaenopsis flavonoid 3′,5′-hydoxylase modifies flower color pigmentation in Petunia and Lilium. Plant Cell Tiss Organ Cult. 2013;115:263–273. doi: 10.1007/s11240-013-0359-2. [DOI] [Google Scholar]
- Schmittgen TD, Livak KJ. Analyzing real-time PCR data by the comparative CT method. Nat Protoc. 2008;3:1101–1108. doi: 10.1038/nprot.2008.73. [DOI] [PubMed] [Google Scholar]
- Shimada OY, Shimada YN, Ohbayashi R, Kiyokawa M, Kikuchi SY. Selective accumulation of delphinidin derivatives in tobacco using putative flavonoid 3′,5′–hydroxylase cDNA from Campanula medium. Bio Sci Biotech Biochem. 2003;67:161–165. doi: 10.1271/bbb.67.161. [DOI] [PubMed] [Google Scholar]
- Sparkes IA, Runions J, Kearns A, Hawes C. Rapid, transient expression of fluorescent fusion proteins in tobacco plants and generation of stably transformed plants. Nat Protoc. 2006;1:2019–2025. doi: 10.1038/nprot.2006.286. [DOI] [PubMed] [Google Scholar]
- Tanaka Y. Flower colour and cytochromes p450. Phytochem Rev. 2006;5:283–291. doi: 10.1007/s11101-006-9003-7. [DOI] [Google Scholar]
- Tanaka Y, Tsuda S, Kusumi T. Metabolic engineering to modify flower color. Plant Cell Physiol. 1998;39:1119–1126. doi: 10.1093/oxfordjournals.pcp.a029312. [DOI] [Google Scholar]
- Tanaka Y, Katsumuto Y, Brugliera F, Mason J. Genetic engineering in floriculture. Plant Cell Tiss Organ Cult. 2005;80:1–24. doi: 10.1007/s11240-004-0739-8. [DOI] [Google Scholar]
- Tanaka Y, Brugliera F, Chandler S. Recent progress of flower colour modification by biotechnology. Int J Mol Sci. 2009;10:5350–5369. doi: 10.3390/ijms10125350. [DOI] [PMC free article] [PubMed] [Google Scholar]
- Wroblewski T, Tomczak A, Michelmore R. Optimization of Agrobacterium-mediated transient assays of gene expression in lettuce, tomato and Arabidopsis. Plant Biotech J. 2005;3:259–273. doi: 10.1111/j.1467-7652.2005.00123.x. [DOI] [PubMed] [Google Scholar]
- Yasmin A, Debener T. Transient gene expression in rose petals via Agrobacterium infiltration. Plant Cell Tiss Organ Cult. 2010;102:45–250. doi: 10.1007/s11240-010-9728-2. [DOI] [Google Scholar]
- Yuki S, Araki S, Suzuki T (2013) Flavonoid-3′, 5′-hydroxylase gene of Commelina communis. US Patent 8,440,879, 2013


