Figure 2.

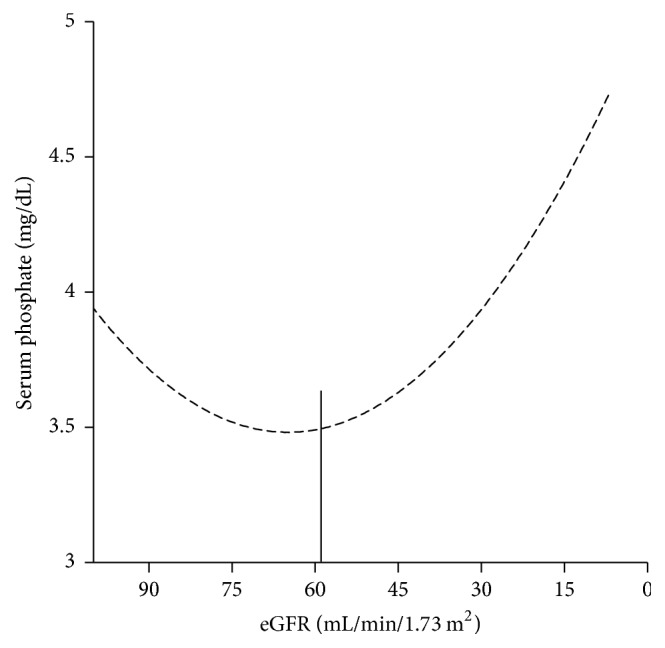
Serum phosphate according to kidney function. Vertical line represents the change in slope. Modified from Chartsrisak et al. [3].

Serum phosphate according to kidney function. Vertical line represents the change in slope. Modified from Chartsrisak et al. [3].