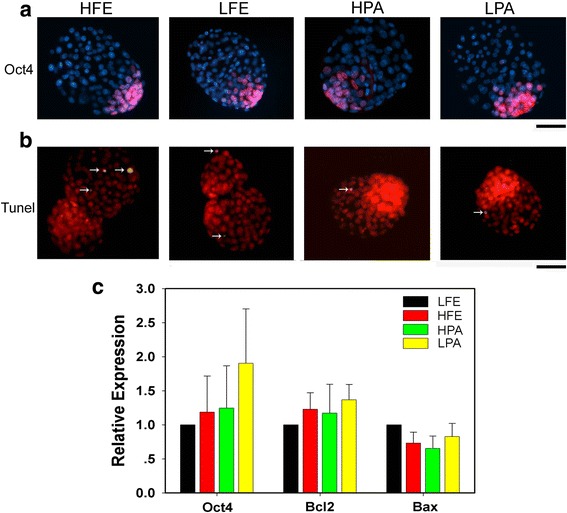
Fig. 2.

Embryonic cell differentiation and apoptosis in blastocysts cultured in vitro. a Immunofluorescent images showing Oct4-positive cells in fertilized and parthenogenetic blastocysts cultured for 120 h in 5% or 20%, indicative of inner cell mass (pink), with nuclei stained with Hoechst (blue). Bar = 50 μm. b Representative merged images showing apoptotic cells (yellow, white arrows) in fertilized and parthenogenetic blastocysts cultured for 120 h in 5% or 20% by TUNEL assay, with nuclei stained with PI (red). Bar = 50 μm. c Quantification of Oct4 and apoptotic genes, including Bcl2 and Bax, in fertilized and parthenogenetic embryos cultured for 96 h. Relative mRNA expression levels are determined by real-time PCR and normalized to β-actin as internal reference, with the average value of LFE groups as control set to one and compared across groups. Data are presented as mean ± SEM. LFE and HFE, fertilized embryos cultured in 5% and 20% O2 respectively; LPA and HPA, parthenogenetic embryos cultured in 5% and 20% O2 respectively
