Fig. 1.

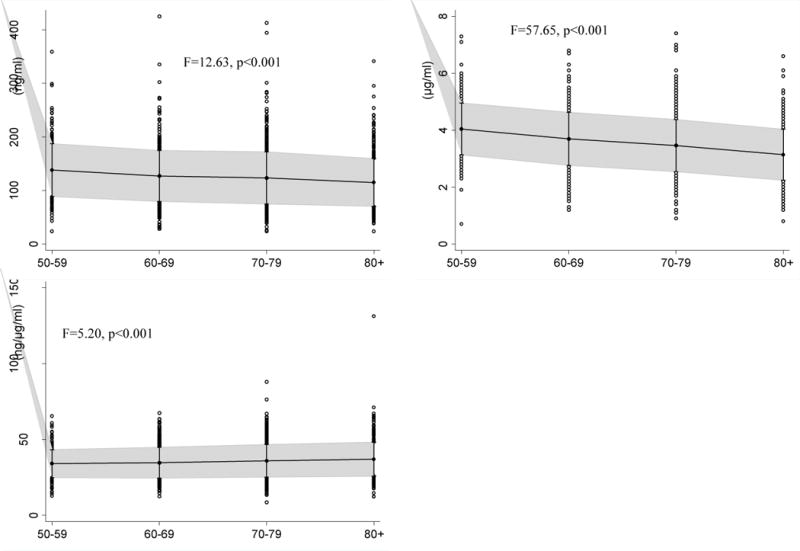
Mean, 95% CI, and data points above and below the CI of plasma levels of total IGF-1 (ng/ml), IGFBP-3 (μg/ml), and IGF-1/IGFBP-3 (ng/μg/ml) ratio by decade at baseline (N=1,618).

Mean, 95% CI, and data points above and below the CI of plasma levels of total IGF-1 (ng/ml), IGFBP-3 (μg/ml), and IGF-1/IGFBP-3 (ng/μg/ml) ratio by decade at baseline (N=1,618).