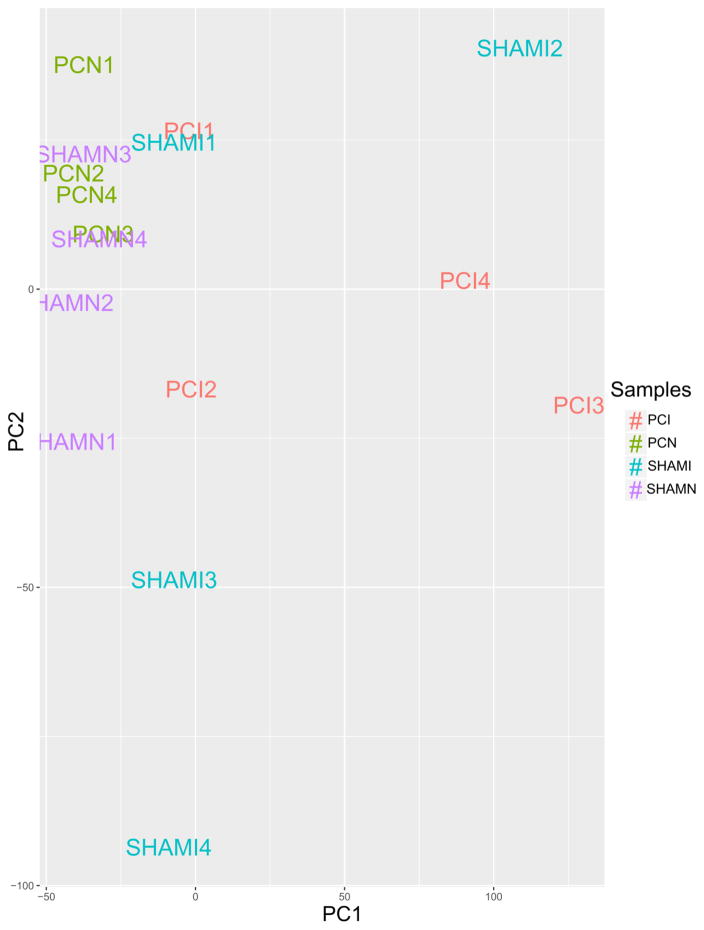
Fig. 2.
Principal Component Analysis (PCA) plot of the filtered, normalized and log2-transformed count matrix, assessing the overall effect of experimental covariates and batch effects - generated with R v. 3.2.2, ggplot2_2.2.1 andggfortify_0.4.1. The first two components (x-and y-axis) were used and next order components are available in the Data Supplement. We noticed a higher variation in PCI3 and PCI4 and ShamI2, most likely due to natural variation in biological samples.

