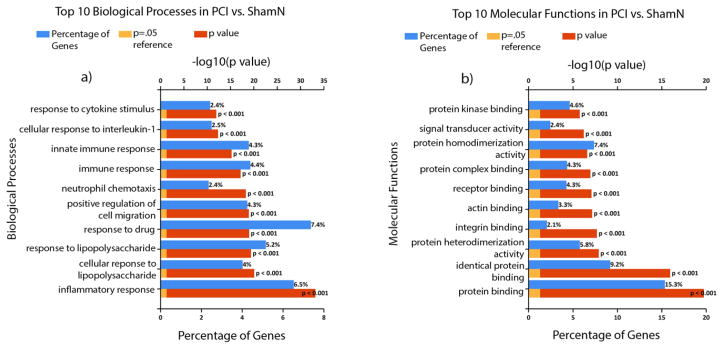
Fig. 4.
Functional analysis figures were generated with FunRich 3.0 [16] and Gene Ontology (GO) Norway rat (Taxon ID: 10116) database [17, 18]. Shown are the top 10 biological processes (a) and molecular functions (b) for PCI vs ShamN arranged according to increasing P (or decreasing log10(P value)). Percentage of differentially expressed genes belonging to each process is shown as blue bars. log10(P =0.05) is shown as a reference.

