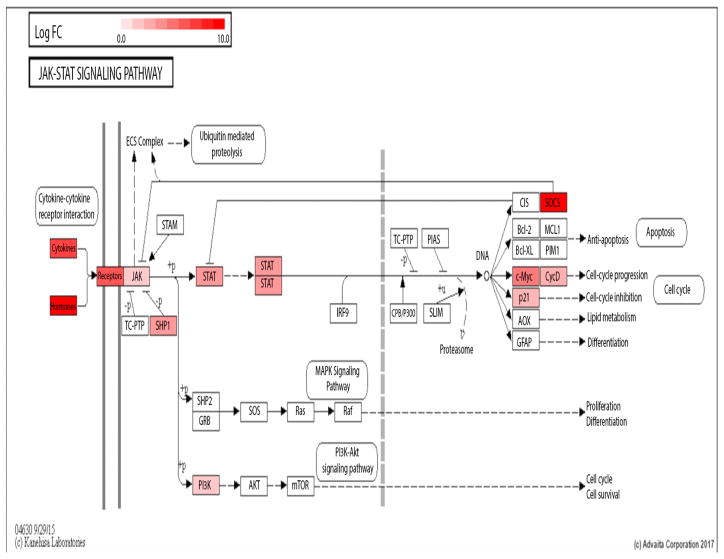
Fig. 7.
Jak-STAT KEGG pathway diagram for PCI vs ShamN and ShamI vs ShamN respectively. Diagrams were downloaded from iPathwayGuide’s pathways feature [19]. Significantly affected genes between conditions are colored and the intensity of the color reveals the magnitude of the fold change of a given gene (genes in red indicate up-regulation; genes in blue indicate down-regulation). Only the genes with an absolute value of log2(fold change) ≥ 2 and Q ≤ 0.05 were considered significant.

