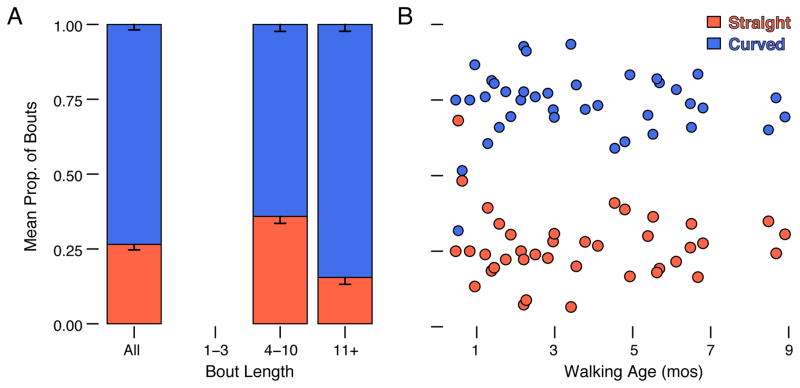
Figure 4.
Mean proportion of curved and straight bouts during free play (N = 40 sessions). (A) Left-most bar shows all bouts and two right bars show bouts with 4–10 steps and 11+ steps, respectively. Note, bouts with 1–3 steps were too short to be scored for path shape as represented by the empty spot along the x-axis. Error bars denote standard errors. Blue bars denote curved paths and orange bars denote straight paths. (B) Scatterplot showing proportion of curved (blue symbols) and straight bouts (orange symbols) by walking age. Each symbol represents the proportion of curved or straight bouts in that session.

