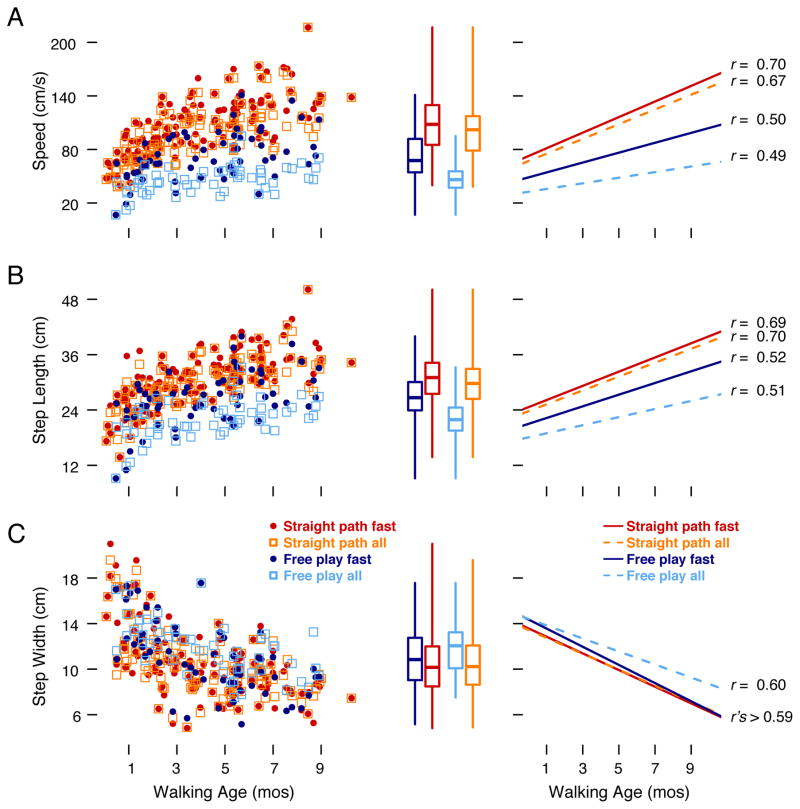
Figure 6.
Gait measures for (A) speed, (B) step length, and (C) step width. Scatterplots in left panel show improvements with walking age in the free-play task (blue symbols, N = 57 sessions) and straight-path task (red symbols, N = 130 sessions) for all bouts (open symbols) and the two fastest (closed symbols) bouts in each task of spontaneous walking and the straight-line paradigm; each symbol represents the average for an individual infant’s session. The scatterplots highlight the wide range in individual differences across walking age. Box plots in the middle panel show the 25th to 75th percentiles (box size), median (horizontal line), and ranges (whiskers) for each measure. Line graphs in the right panel show linear curve fits and correlation coefficients for the data in the scatterplots; blue lines denote free play, red lines denote the straight-path task, solid lines represent all sequences, and dashed lines represent the two fastest sequences.

