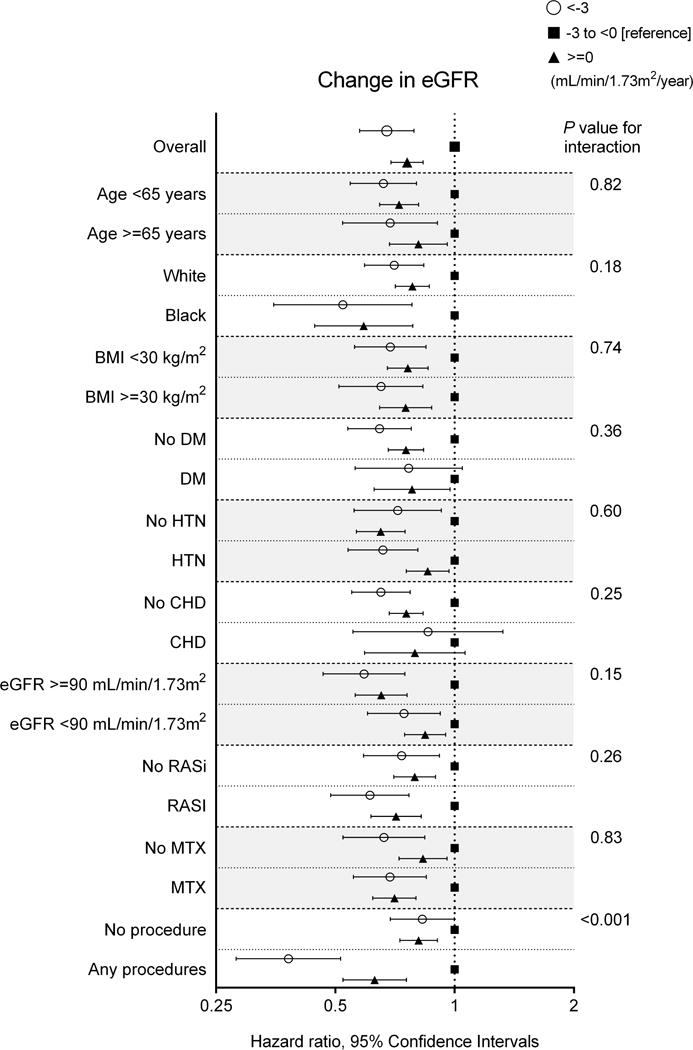
Figure 3. Association of biologic treatment with change in eGFR in predefined subgroups in the propensity-matched cohort.

Abbreviations: BMI = body mass index; CHD = coronary heart disease; DM = diabetes mellitus; eGFR = estimated glomerular filtration rate; HTN = hypertension.
