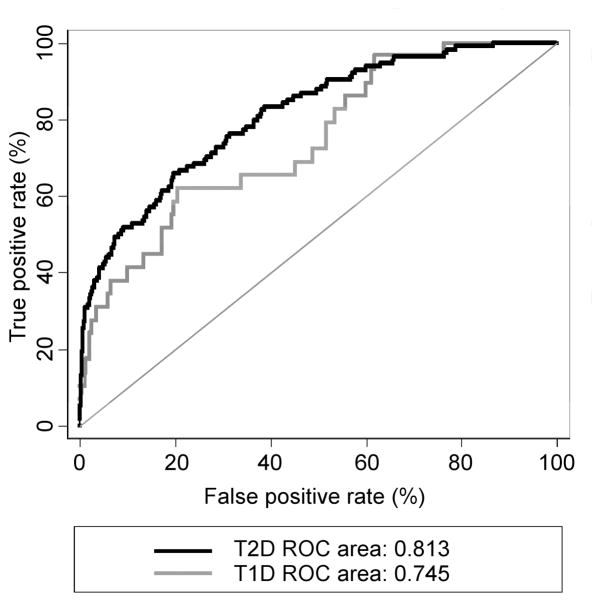
Figure 2.
ROC curves for the multi-marker risk score of early renal decline in type 2 diabetes (T2D, training cohort, solid black line) and type 1 diabetes (T1D, validation cohort dotted grey line). The T1D cohort characteristics are provided in the Supplemental Material.

