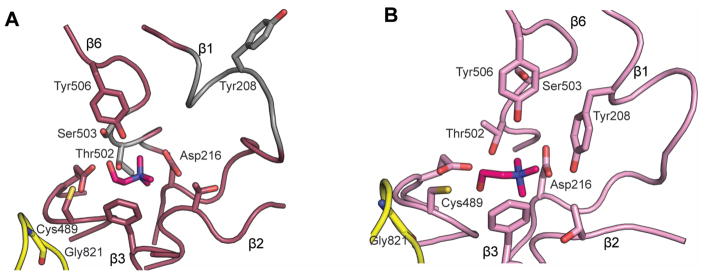
Figure 8. Comparison of CutC structure with GDH-based CutC homology model.
A. Homology model of CutC (Bodea et al., 2016) created in Modeller using GDH as the starting model; choline (magenta) was docked using Schrodinger Suite 2012. Residues that differ substantially from the observed positions in the crystal structure are colored gray, with most signification differences observed for Tyr298, Thr502, and Ser503. B. The crystal structure of CutC bound to choline (magenta, PDB ID: 5FAU) in the same orientation as in A. A color version of this figure is available online.

