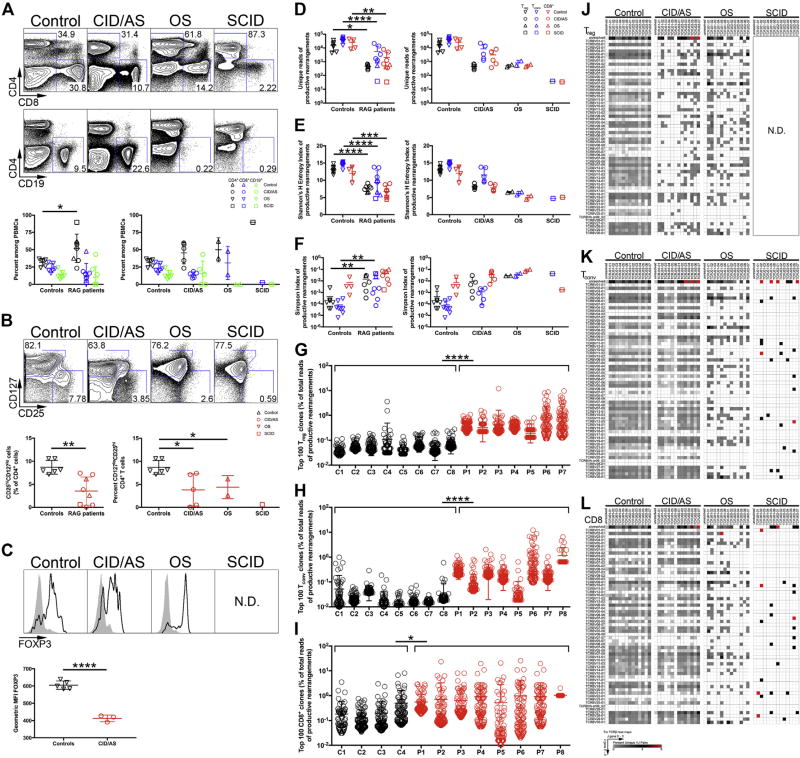
FIG 1.
Flow cytometric and repertoire analysis of peripheral blood lymphocyte populations in patients with RAG mutations. A, Gating strategy for circulating CD4+, CD8+, and CD19+ lymphocytes (top) and relative proportions (bottom) in controls and RAG-mutated patients. B, Identification (top) and frequency (bottom) of Treg cells among CD4+ lymphocytes by CD25 and CD127 expression. C, FOXP3 expression in CD4+CD25hiCD127lo Treg cells (black line) and CD4+CD25−CD127+ Tconv cells (gray fill) from controls or patients (top). Geometric mean fluorescent intensity of FOXP3 protein expression in controls and patients with CID/AS (bottom). D, Unique TRB productive rearrangements for each subject’s T-cell subpopulation. Shannon’s H Entropy (E) and Simpson (F) index of diversity for productive TRB rearrangements. Frequency of 100 most abundant productive TRB clonotypes identified in Treg (G), CD4+ Tconv (H), and CD8+ (I) cells for patients (P1–P8) and controls (C1–C8). Representative heat maps depicting TRBV (rows) and TRBJ (columns) gene pairing in unique productive TRB rearrangements in Treg (J), Tconv (K), orCD8+ T cells (L) (5′to 3′ orientation of V and J genes). ND, Not done. Student t test (Gaussian distribution) or Mann-Whitney test (non-Gaussian distribution) was used for flow cytometric statistical analysis and 2-way ANOVA was used for repertoire analysis with *P < .05, **P < .01, ***P < .001, and ****P < .0001. Bars represent mean ± SD.

