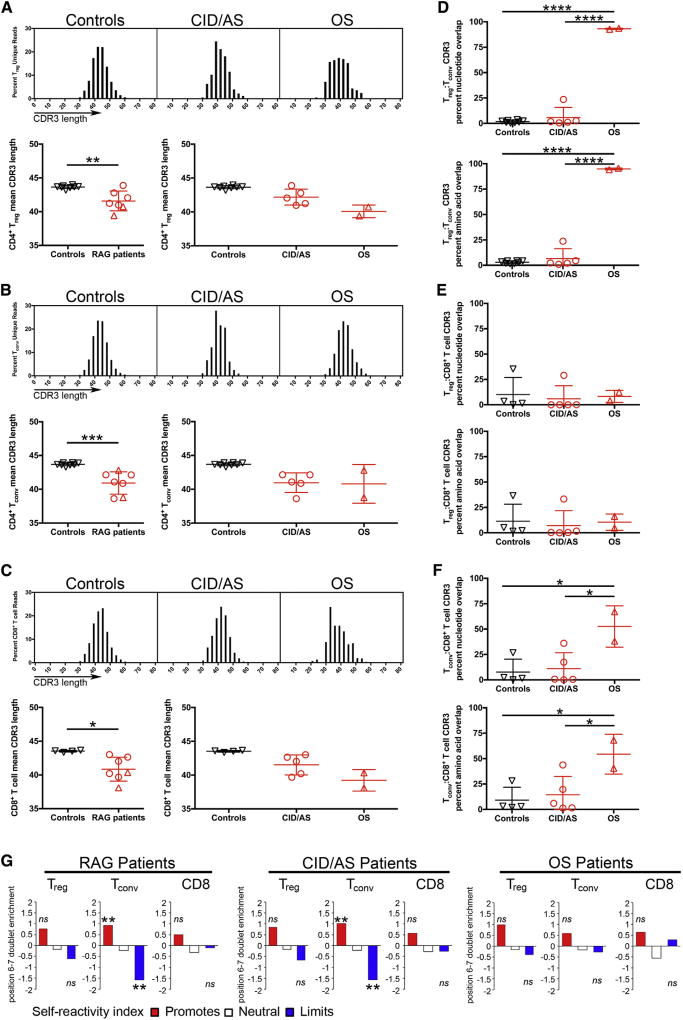
FIG 2.
Molecular characteristics of CDR3 of productive TRB rearrangements. Virtual spectratyping of CDR3 nucleotide length (top) and mean CDR3 length (bottom) of unique rearranged products in Treg (A), CD4+ Tconv (B), andCD8+ T (C) cells from controls and patients. TRB-CDR3 sequence homology at the nucleotide (top) and amino acid (bottom) level in different T-cell subsets (D–F). Self-reactivity index of Treg, Tconv, and CD8+ cells from all RAG-mutated patients (left), patients with CID/AS (middle), or patients with OS (right) compared with equivalent control subpopulations (G). ns, Not significant. Student t test was used for statistical analysis with *P < .05, **P < .01, ***P < .001, and ****P < .0001. In panels A–F, bars represent mean ± SD. **P < 10−10.

