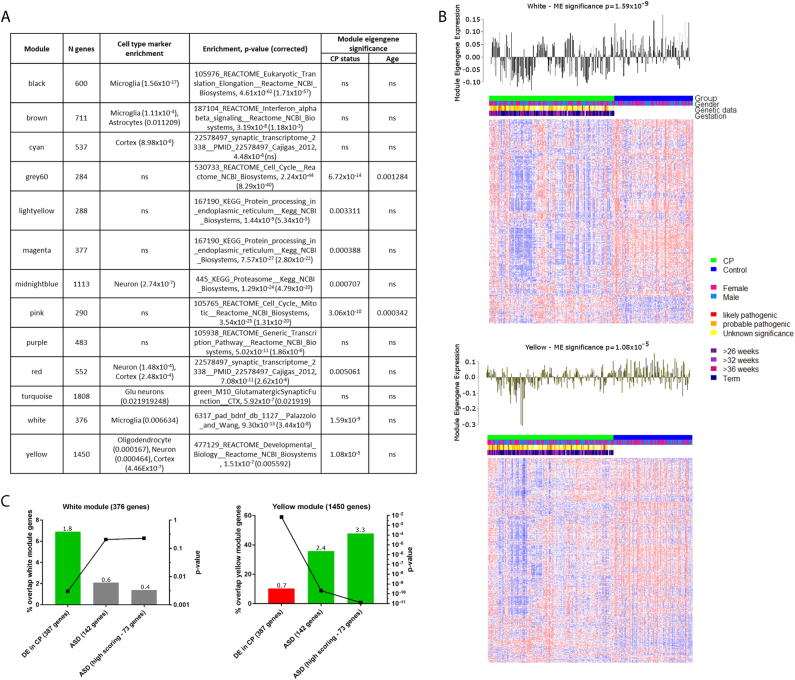
Fig. 3. Gene co-expression modules in the control lymphoblastoid cell line network.
a Modules in control network with cell type marker enrichments and functional annotation enrichment. Module eigengene significance for each module denotes whether there is an association between expression of the module and characteristics of the samples. b Heatmap of genes belonging to the white and yellow gene co-expression modules, which have the most significant association with CP status. All genes in the white module are shown (376 genes), while the larger yellow module consisting of 1450 genes was limited to the top 300 genes ranked by connectivity to all other genes in the module. Corresponding module eigengene values (y-axis) across samples (x-axis) (top). c Enrichment analysis (hypergeometric probability) of white and yellow modules with ASD gene sets and differentially expressed genes in CP. Left axis is bar plot of percentage overlap between each gene list and CP DE gene list, with numbers above each bar being the fold difference of the observed to expected overlap between these gene lists. Right axis is a dot plot of p values derived from hypergeometric distribution analysis of overlap between each gene list and the genes in the white and yellow modules

