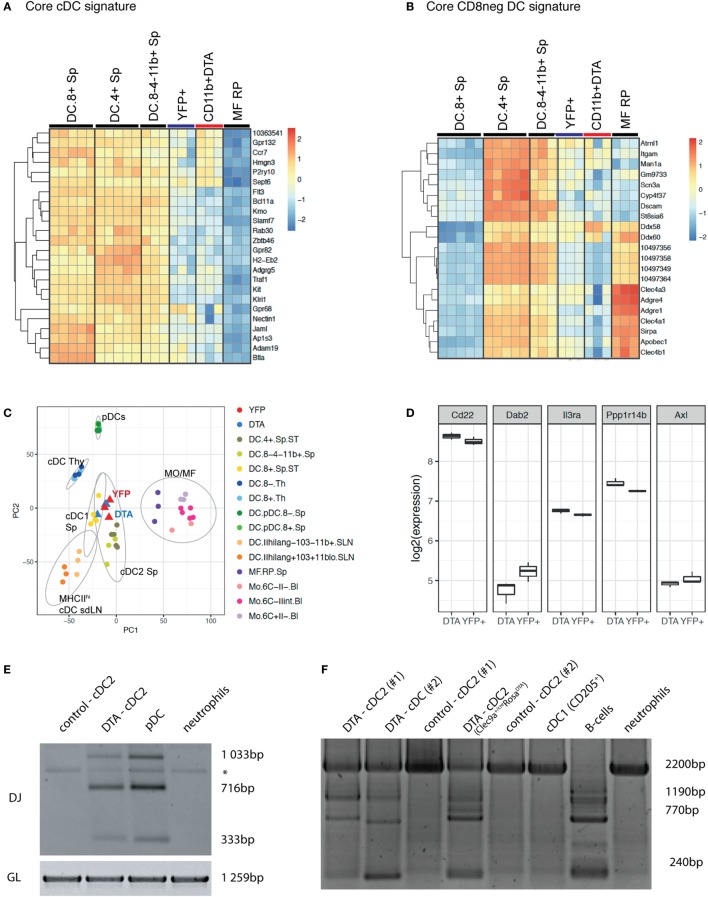
Figure 5.
cDC2 from Clec9aCre/CreRosaDTA mice are transcriptionally similar to bona fide cDC2 but exhibit somatic rearrangements of lymphoid receptor genes. Splenic CD11c+MHCII+CD11b+ cDC2 from Clec9acre/creRosaDTA mice (CD11b+ DTA) and CD11c+MHCII+CD11b+YFP+ cDC2 (YFP+) from Clec9acre/creRosaYFP mice were sorted and subjected to microarray analysis. (A,B) Population clustering and heat map display of the relative expression values for core conventional dendritic cells (cDC) signature genes (A) and core CD8neg cDC signature genes (B) comparing cDC2 from Clec9acre/creRosaDTA mice and YFP+ cDC2 to the indicated murine cDC and macrophage populations from the Immgen database. (C) Principle component analysis (PCA) was performed on 50% of the genes defined by highest variance across all samples. Each dot of the same color represents a replicate sample. For each cluster, normal confidence ellipses are indicated. (D) Box plots of the log2 expression values of the indicated genes in cDC2 from Clec9acre/creRosaDTA mice and YFP+ cDC2. (E,F) CD11c+MHCII+CD11b+ cDC2 from control and Clec9acre/creRosaDTA mice were sorted and genomic DNA was isolated. (E) Polymerase chain reaction (PCR) was performed using primers for the germline (GL) locus and primer mixtures homologous for regions of the Dfl16 and Dsp2 D gene families for detecting D–J rearrangements of the IgH chain. DJ rearrangements in pDCs (SiglecH+B220+) and neutrophils (Ly-6G+) are shown as control. * indicates an unspecific band. (F) Genomic PCR was performed using primers for the GL locus and primer sets for the DHQ52 element for detecting D–J rearrangements of the IgH chain. DJ rearrangements in pDCs (SiglecH+B220+), CD205+ cDC1, and neutrophils (Ly-6G+) are shown as control. Each lane in E and F represents independent replicates from different mice.

