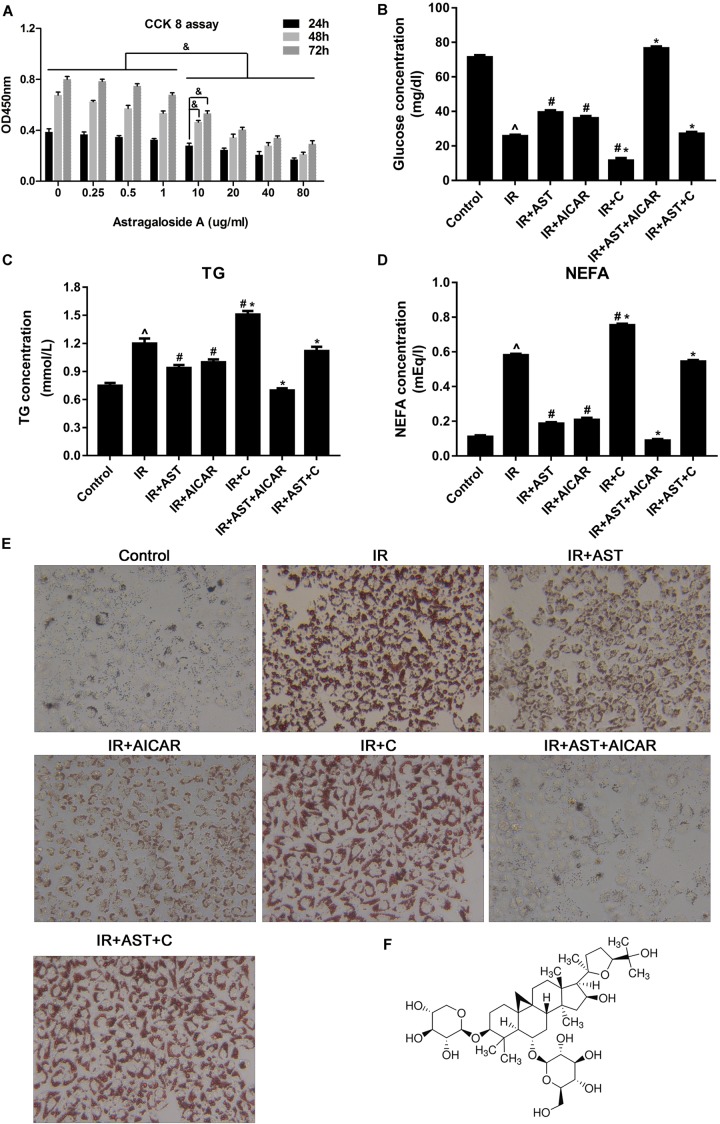
FIGURE 1.
AMP-activated protein kinase (AMPK) activation by AST blunted dysfunction of lipid metabolism and insulin resistance in HepG2 cells. (A) Evaluation of AST cytotoxicity when incubated with cells at concentrations of 0.25, 0.5, 1.0, 10, 20, 40, and 80 μg/mL for 24, 48, and 72 h. AST improved glucose consumption (B) and decreased TG (C), and NEFA (D) levels in insulin-resistant HepG2 cells. (E) Representative gross morphology of a triglyceride accumulation in insulin-resistant HepG2 cells as visualized by Oil Red O staining; magnification: ×200∗. (F) Chemical structure of AST. AST, astragalosidea; C, compound C; TG, triglyceride; NEFA, non-esterified fatty acid; IR, insulin resistance. Date represent the mean SD, as determined by one-way ANOVA, ˆp < 0.05 vs. the control group.∗p < 0.05 vs. the IR+AST group; #p < 0.05, vs. the IR group; &p < 0.05.

