
FIGURE 1.
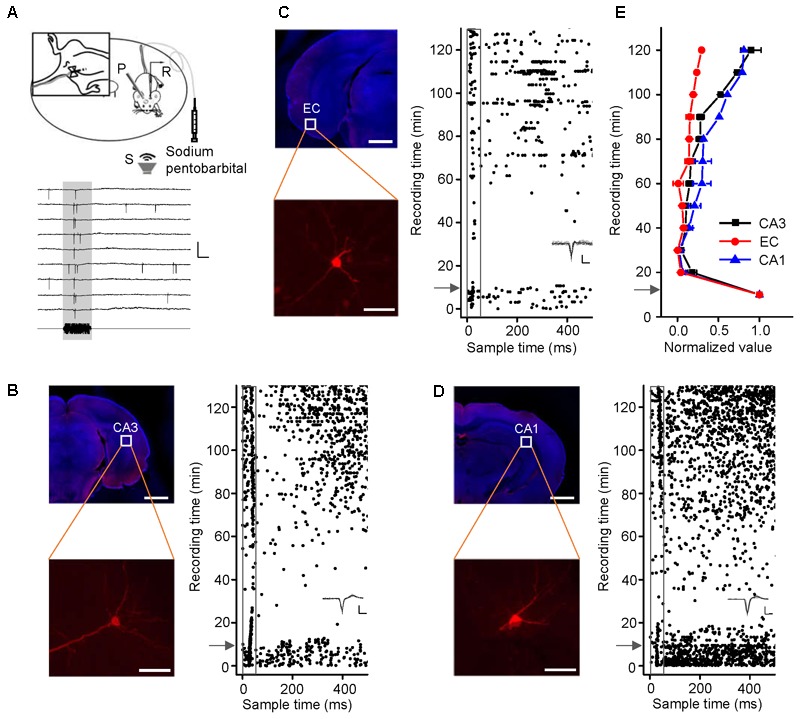
Noise-evoked responses of hippocampal neurons in awake and pentobarbital-anesthetized mice. (A) Top, diagram of loose-patch recordings in awake, head-fixed mice. The upper left panel shows an indwelling needle for intraperitoneal injection of sodium pentobarbital. R, recording electrode; P, metal post for head fixation; S, sound source. Bottom, 275-ms raw traces showing that the noise stimuli evoked spikes. Scale bars: y = 2 mV, x = 20 ms; the gray shade indicates the duration of the sound stimulation (50 ms). (B–D) Noise-evoked responses (right panels, raster plots) of neurons (left panels, Scale bar, 1000 μm; Enlarged figure, Scale bar, 50 μm) in the CA3 (B), entorhinal cortex (EC) (C), and CA1 (D) regions of mice before and after sodium pentobarbital injection (arrows). The gray boxes indicate 50-ms-long acoustic stimulation. Inset: 20 randomly selected superimposed spike waveforms. Scale: 40 pA, 0.5 ms. (E) Changes in the normalized responses of neurons in the CA3 (black, n = 4), EC (red, n = 3), and CA1 (blue, n = 3) regions after a pentobarbital injection. Each point represents a spike rate normalized by that measured before the injection.