
FIGURE 3.
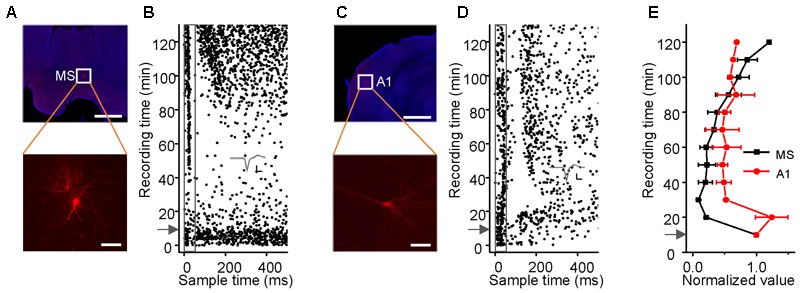
Effects of sodium pentobarbital on the responses of MS and A1 neurons to noise. (A–D) Noise-evoked responses (B,D, raster plots) of neurons (A,C, lower panels, Scale bar, 50 μm) located (A,C, upper panels, Scale bar, 1000 μm) in the MS and A1 before and after sodium pentobarbital injection (arrows). Inset: 20 randomly selected superimposed spike waveforms. Scale: 40 pA, 0.5 ms. (E) Changes in the spike rate (mean ± SEM) of a single neuron in the MS (black, n = 3) and A1 (red, n = 3) after the injection. Each point represents a spike rate normalized by that measured during a 10-min period prior to the injection.