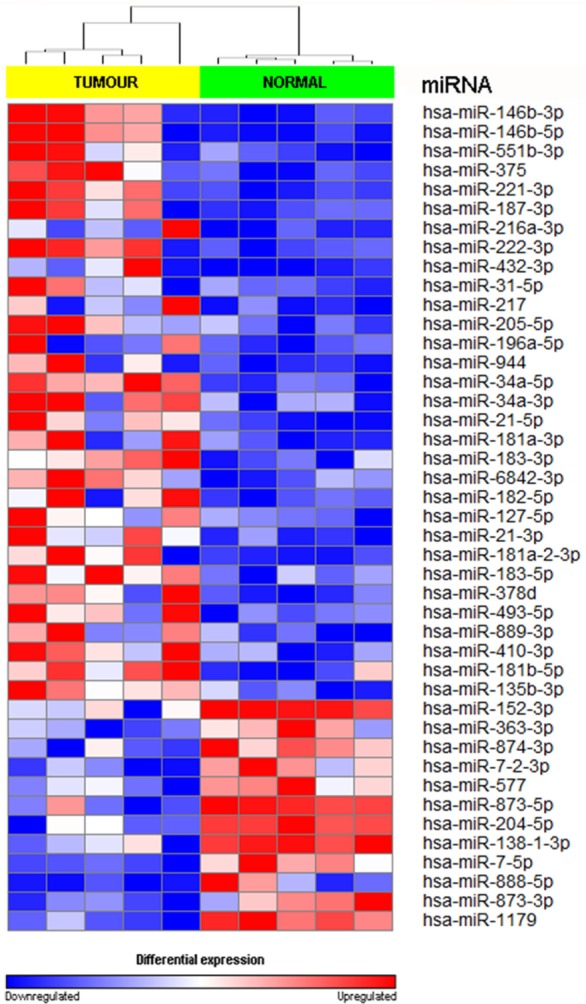
Figure 2.

Hierarchical clustering and heatmap for microRNA (miRNA) expression profile in papillary thyroid carcinoma LNN versus adjacent normal comparison group. The list of miRNA were filtered with p value <0.05 and log2-fold change ≤−1.0 or ≥1.0. A total of 43 miRNA have significant differentially expression. The sample labeled in yellow bar represents tumor sample while green bar represents normal samples. Color key illustrate the relative expression of miRNA in all samples. Red indicates high expression level while blue indicate low expression level. Dendrogram showed that all samples were clustered well according to their respective groups.
