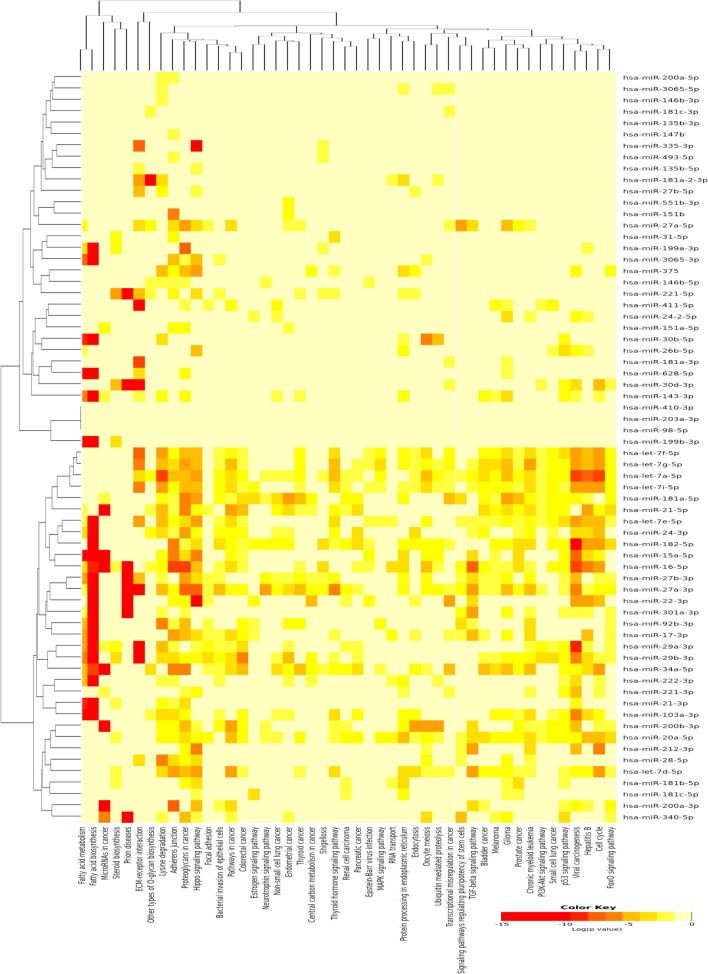
Figure 3.
Pathway enrichment analysis on 66 upregulated microRNA (miRNA) in papillary thyroid carcinoma LNM-P and heatmap for miRNA versus pathway (clustered based on their significance value) using DIANA miRPath v3.0 software. Dendrogram on both axis represent hierarchical clustering resulting from miRNA and pathway. The miRNA were clustered together with similar pathway pattern and the pathways were clustered together based on related miRNAs.

