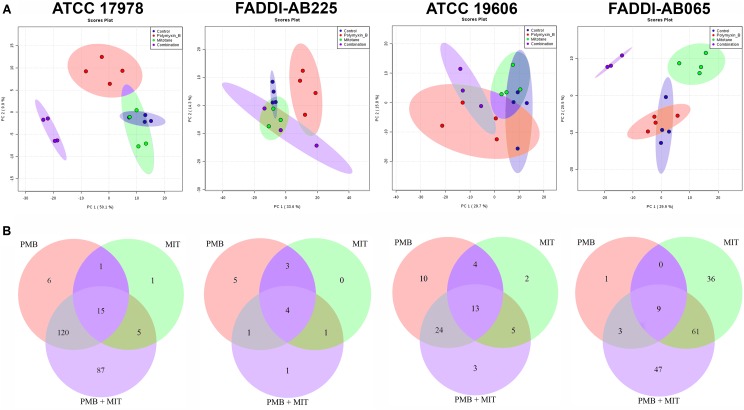
FIGURE 1.
(A) PCA score plots showing metabolomic variance for untreated samples (blue) and samples treated with polymyxin B (red), mitotane (green) and combination (purple) for each A. baumannii strain along principal components 1 and 2. The degree of separation shows the level of variance between these groups. Principal component 1 axis is responsible for higher level of variance. (B) Venn diagrams showing the number of statistically significant metabolites affected by different treatments (one-way ANOVA, FDR ≤ 0.05; Fisher’s LSD, p ≤ 0.05) in each A. baumannii strain (PMB, polymyxin B; MIT, mitotane).

