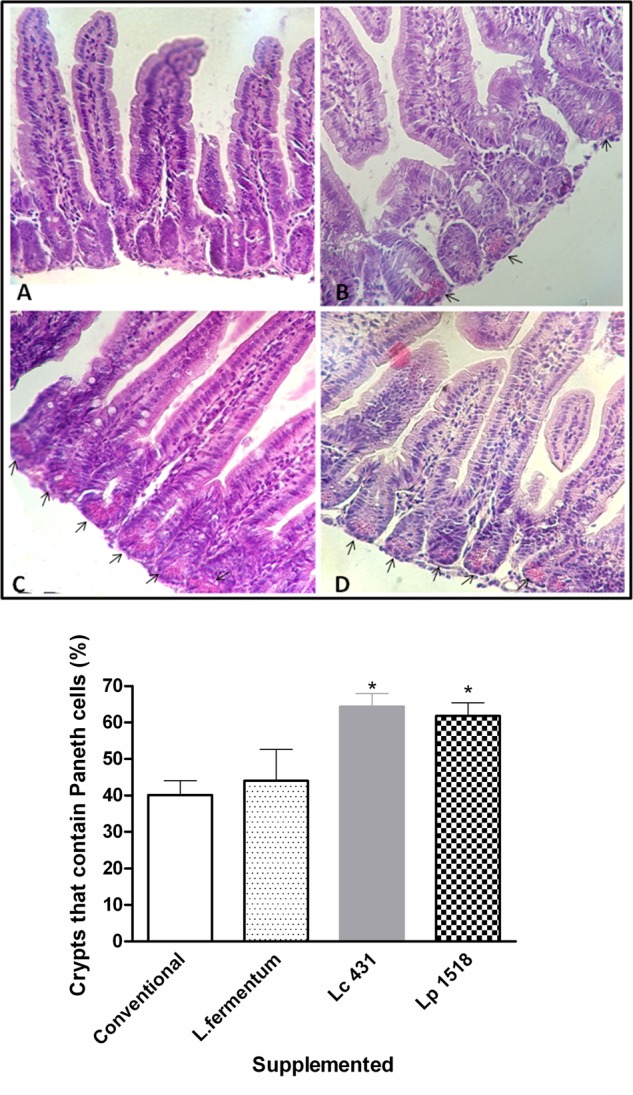
FIGURE 1.

Paneth cells at the base of intestine crypt. Tissue sections of 42 days mice fed with conventional diet (A), Lactobacillus fermentum (B), L. casei CRL 431 (C), or L. paracasei CNCM-I 1518 (D), were stained with hematoxylin and eosin and examined by light microscopy. A blind histological test of small intestine was done by analyzing 100 intestinal crypts in 5 slices of each organ; and the percentages of crypts with positive Paneth cells were determined in each group. Photographs are representative of three independent experiments. Magnification 400×. Arrows point to the Paneth cells in the base of the crypt. The columns bar figure shows semi-quantitatively evaluation for each group. Each bar represents the group mean ± SEM. Results are representative of three independent experiments. ∗p < 0.05.
