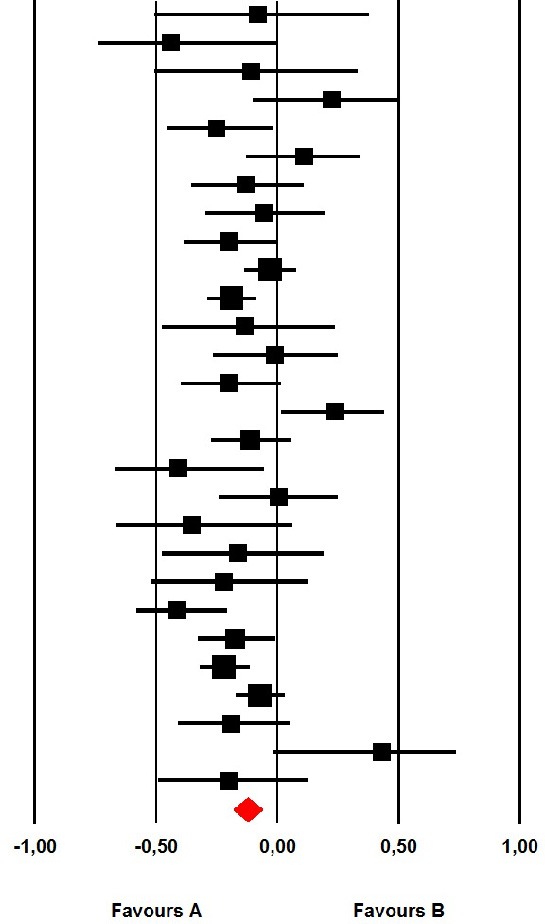
Table 2.
Forest plot of correlations between the TAS-20 and the LEAS of included studies.
| Study name | Subgroup within study | Statistics for each study | Correlation and 95% Cl | |||
|---|---|---|---|---|---|---|
| Correlation | Lower limit | Upper limit | p-value | |||
| Baker et al., 2014 | Healthy | −0.080 | −0.505 | 0.376 | 0.741 |  |
| Baker et al., 2014 | Psychiatric | −0.440 | −0.739 | 0.003 | 0.052 | |
| Baeza-Velasco et al., 2012 | Healthy | −0.108 | −0.507 | 0.329 | 0.636 | |
| Baeza-Velasco et al., 2012 | Medical | 0.224 | −0.098 | 0.504 | 0.172 | |
| Burger et al., 2016 | Medical | −0.249 | −0.454 | −0.018 | 0.035 | |
| Bydlowski et al., 2005 | Healthy | 0.110 | −0.128 | 0.336 | 0.366 | |
| Bydlowski et al., 2005 | Psychiatric | −0.130 | −0.354 | 0.108 | 0.285 | |
| Carton et al., 2010 | Psychiatric | −0.055 | −0.297 | 0.193 | 0.667 | |
| Consoli et al., 2009 | Medical | −0.200 | −0.383 | −0.002 | 0.048 | |
| Igarashi et al., 2011 | Healthy | −0.030 | −0.135 | 0.076 | 0.579 | |
| Lane et al., 1998b | Healthy | −0.190 | −0.285 | −0.091 | 0.000 | |
| Lane et al., 2015a | Medical | −0.136 | −0.473 | 0.236 | 0.477 | |
| Lane et al., 2015a | Psychiatric | −0.009 | −0.264 | 0.248 | 0.946 | |
| Lichev et al., 2014 | Healthy | −0.200 | −0.397 | 0.015 | 0.068 | |
| Lundh et al., 2002 | Healthy | 0.240 | 0.018 | 0.439 | 0.034 | |
| Lumley et al., 2005 | Healthy | −0.110 | −0.271 | 0.057 | 0.196 | |
| Maroti et al., 2017 | Healthy | −0.409 | −0.670 | −0.057 | 0.024 | |
| Maroti et al., 2017 | Medical | 0.006 | −0.238 | 0.250 | 0.962 | |
| Neumann et al., 2017 | Medical | −0.353 | −0.662 | 0.059 | 0.091 | |
| Parling et al., 2010 | Healthy | −0.160 | −0.473 | 0.188 | 0.369 | |
| Parling et al., 2010 | Psychiatric | −0.220 | −0.515 | 0.122 | 0.206 | |
| Pietri and Bonett, 2016 | Mixed | −0.410 | −0.578 | −0.209 | 0.000 | |
| Simson et al., 2002 | Psychiatric | −0.173 | −0.326 | −0.011 | 0.037 | |
| Subic-Wrana et al., 2001 | Healthy | −0.220 | −0.319 | −0.116 | 0.000 | |
| Subic-Wrana et al., 2005 | Psychiatric | −0.072 | −0.171 | 0.028 | 0.158 | |
| Suslow et al., 2000 | Mixed | −0.190 | −0.410 | 0.051 | 0.121 | |
| Waller and Scheidt, 2004 | Healthy | 0.430 | −0.015 | 0.733 | 0.058 | |
| Waller and Scheidt, 2004 | Psychiatric | −0.200 | −0.488 | 0.128 | 0.230 | |
| Total | −0.122 | −0.180 | −0.064 | 0.000 | ||
