
Figure 4.
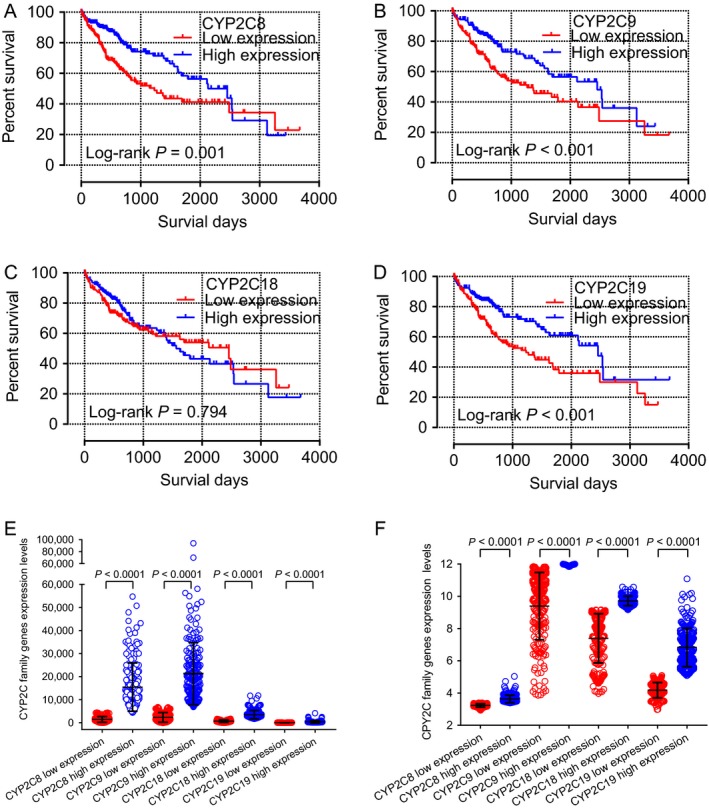
Kaplan–Meier survival curves of the CYP2C8 (A), CYP2C9 (B), CYP2C18 (C), and CYP2C19 (D) genes in the TCGA database. Scatter plots of CYP2C8,CYP2C9,CYP2C18, and CYP2C19 genes expression levels in the TCGA database (E) and GEO database (F).
Official websites use .gov
A
.gov website belongs to an official
government organization in the United States.
Secure .gov websites use HTTPS
A lock (
) or https:// means you've safely
connected to the .gov website. Share sensitive
information only on official, secure websites.
Kaplan–Meier survival curves of the CYP2C8 (A), CYP2C9 (B), CYP2C18 (C), and CYP2C19 (D) genes in the TCGA database. Scatter plots of CYP2C8,CYP2C9,CYP2C18, and CYP2C19 genes expression levels in the TCGA database (E) and GEO database (F).