Figure 6.

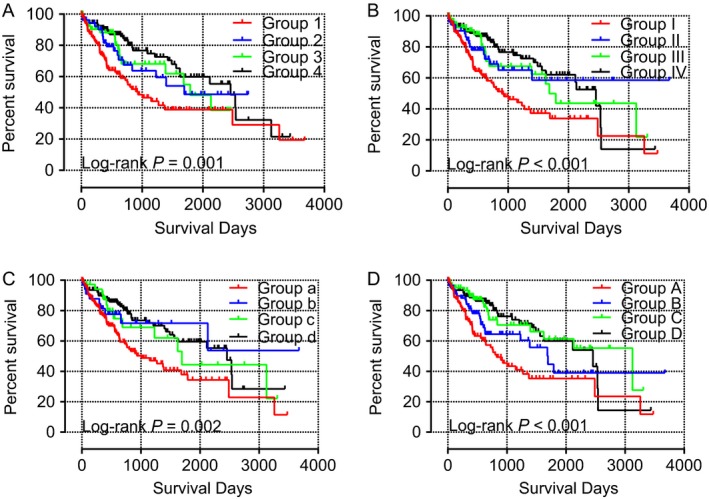
Survival curves of the joint effects analysis of the combination of CYP2C8 and CYP2C9 (A), CYP2C8 and CYP2C19 (B), CYP2C9 and CYP2C19 (C), and CYP2C8,CYP2C9, and CYP2C19 (D) in the TCGA database.

Survival curves of the joint effects analysis of the combination of CYP2C8 and CYP2C9 (A), CYP2C8 and CYP2C19 (B), CYP2C9 and CYP2C19 (C), and CYP2C8,CYP2C9, and CYP2C19 (D) in the TCGA database.