
Figure 5.
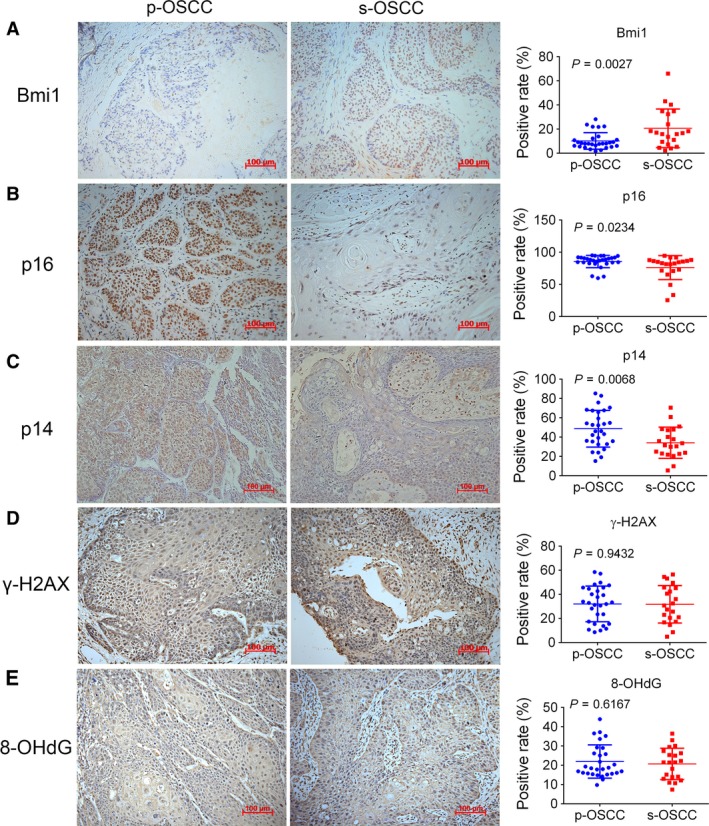
Representative images (200×) of IHC staining for Bmi1, p16, p14, γ‐H2AX, and 8‐OHdG in s‐OSCC and p‐OSCC. P values are computed by Student's t‐test, and P < 0.05 is considered as statistically significant. Scale bar: 100 μm. IHC, immunohistochemistry; OSCC, oral squamous cell carcinoma; p‐OSCC, primary OSCC; s‐OSCC, second primary OSCC after radiotherapy for nasopharyngeal carcinoma.