
Figure 2.
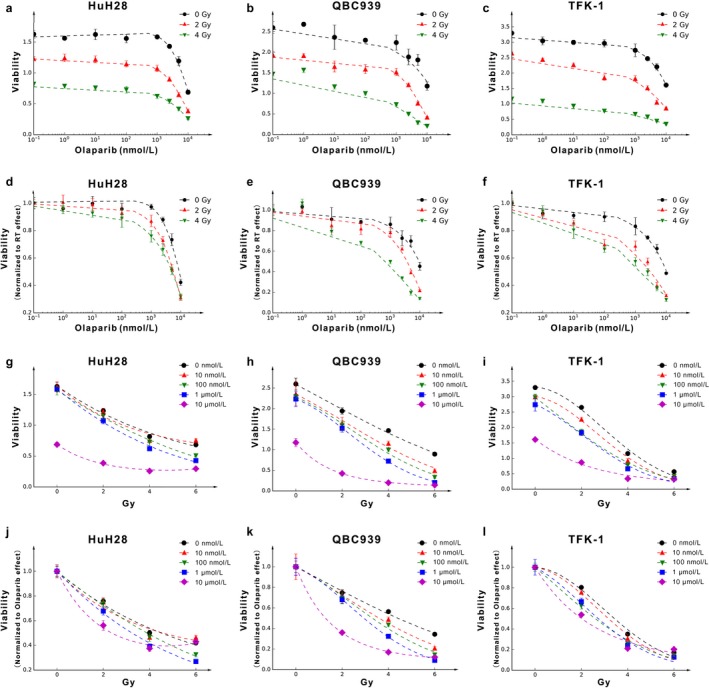
The radiosensitization effect of olaparib in different cell lines. (a–c) Survival in HuH28, QBC939 and TFK‐1 cells after radiation and continuous olaparib exposure as determined by viability assays, with the X‐axis denoting the olaparib dose. (d–f) The viability is normalized to nonirradiated values at different olaparib doses. (g–i) Survival in HuH28, QBC939 and TFK‐1 cells after radiation and continuous olaparib exposure as determined by viability assays, with the X‐axis denoting the radiation dose. (j–l) The viability is normalized to DMSO‐only (presented as 10−1 nmol/L) treatment values at different radiation doses.