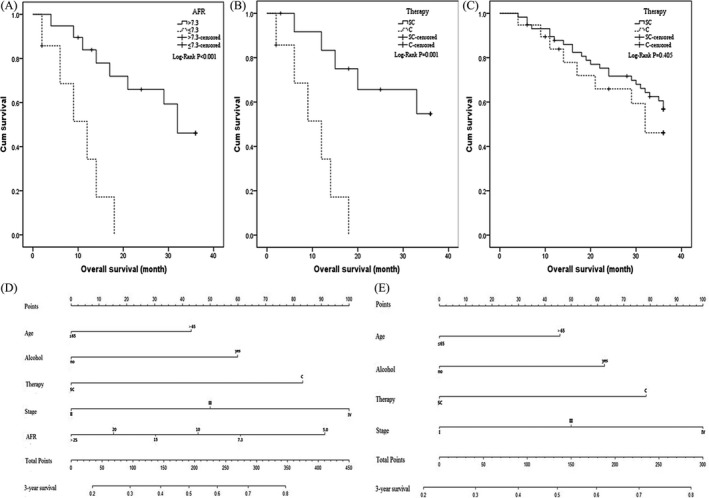
Figure 5.

Kaplan–Meier curves of stage II–III NSCLC patients with treatment of chemo‐radiotherapy(C therapy) or combined surgical resection and chemo‐radiology (SC therapy) in low and high AFR subgroups and predicted nomogram including or without AFR for NSCLC patients. (A) Kaplan–Meier curve for overall survival probability within stage II–III NSCLC patients receiving chemo‐radiotherapy according to circulating AFR concentration; (B and C): Kaplan–Meier curve for overall survival probability within stage II–III NSCLC patients according to two therapy methods in low AFR group and high‐AFR group, respectively; (D) nomogram including AFR for predicting 3‐year OS in NSCLC patients undergoing chemo‐radiotherapy. (E) nomogram without AFR for predicting 3‐year OS in NSCLC patients undergoing chemo‐radiotherapy.
