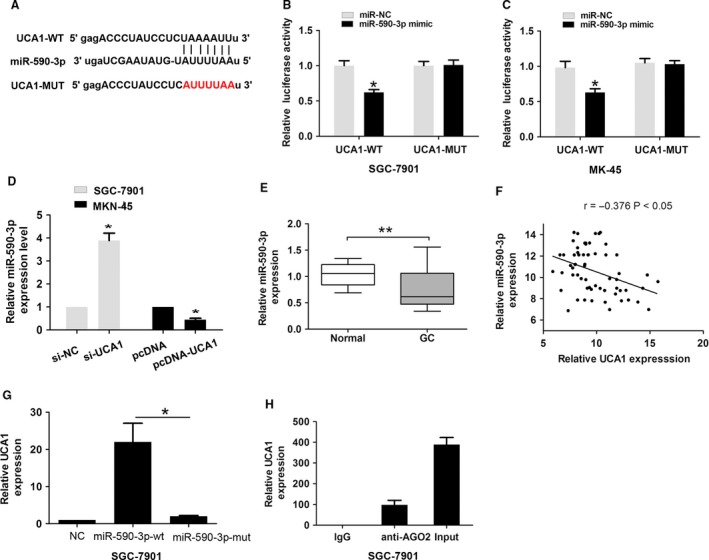
Figure 3.

UCA1 acted as a molecular sponge for miR‐590‐3p in GC cells. (A) Alignment of potential UCA1 base pairing with miR‐590‐3p was predicted by miRanda. (B–C) The relative luciferase activities were detected by transfecting pmirGlo‐UCA1‐WT or pmirGLo‐UCA1‐MUT and miR‐590‐3p or miR‐NC into SGC‐7901 and MKN‐45 cells. (D) The relative expression of miR‐590‐3p was measured after knockdown of UCA1 in SGC‐7901 cells or overexpression of UCA1 in MKN‐45 cells by qRT‐PCR. (E) The relative expression of miR‐590‐3p was measured in GC tissues when compared with adjacent normal tissues by qRT‐PCR. (F) The correlation between UCA1 and miR‐590‐3p level was measured in 62 GC tissues by Pearson correlation analysis. (G) RNA pull‐down assay with biotinylated‐NC, biotinylated miR‐590‐3p‐wt, and biotinylated miR‐590‐3p‐mut probe. The relative expression of UCA1 was measured by qRT‐PCR. (H) RNA‐binding protein immunoprecipitation experiment using negative control (mouse IgG) and Ago2 antibody was performed. The relative expression of UCA1 was measured by qRT‐PCR. The data are presented as the mean ± SD from three independent experiments.*P < 0.05, **P < 0.01; GC, gastric cancer by qRT‐PCR, Quantitative real‐time reverse transcription PCR.
