
Figure 4.
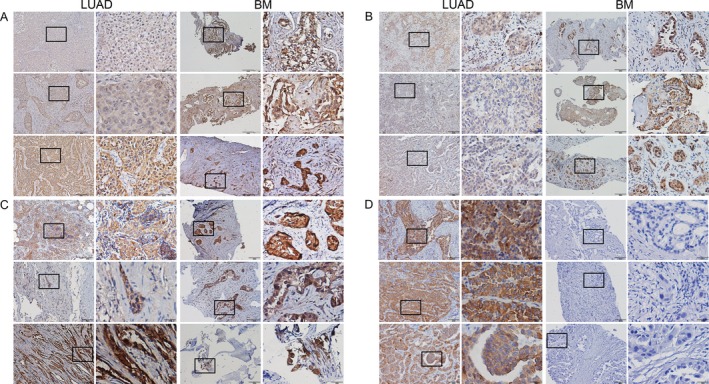
Differential expression of proteins tested by IHC. Detection of ENO1, RPLP2, NME1‐NME2, and CAPS1 in LUAD tissues compared with BM ones (original magnification x100, x400, A, B, C, and D: ENO1, RPLP2, NME1‐NME2, and CAPS1: n = 3 per LUAD and LUAD with BM). Representative data were shown.