
Figure 4.
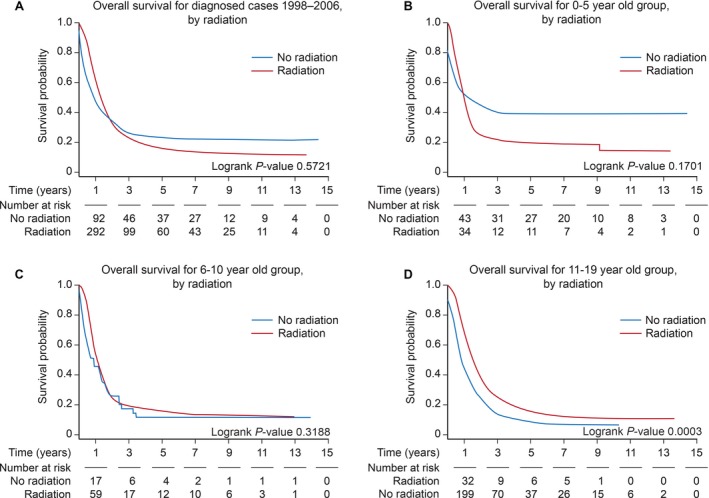
Kaplan–Meier survival in patients receiving radiation in the 0 to 5‐, 5 to 10‐, and 11 to 19‐year‐old age groups from 1998 to 2006. X‐axis: time in years. Y‐axis: survival probability. (A) Kaplan–Meier survival in all pediatric patients receiving radiation. (B) Kaplan–Meier survival in the 0 to 5‐year‐old age group. (C) Kaplan–Meier survival in the 6 to 10‐year‐old age group. (D) Kaplan–Meier survival in the 11 to 19‐year‐old age group.