Figure 2.

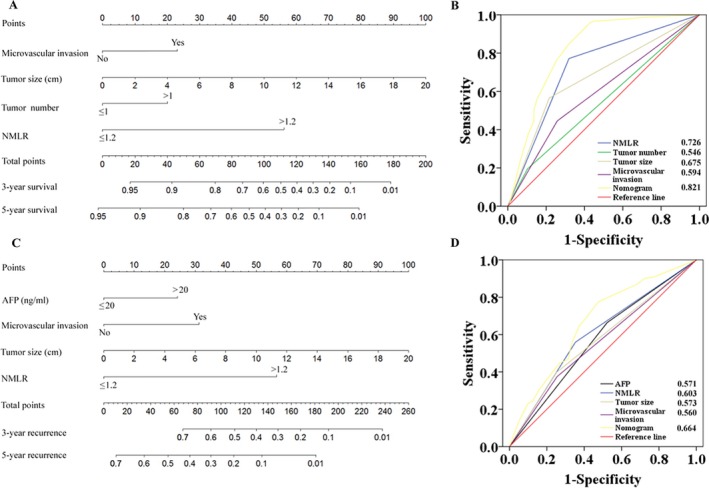
The 3‐ and 5‐year overall survival (OS, A) and recurrence‐free survival (RFS, C) nomograms and predictive accuracy comparison of each variable included in the OS (B) and RFS (D) nomograms by ROC curve analyses. For each predictor, a straight upward line is drawn to determine the points accrued. The sum of these points is plotted on the total points bar, and a straight downward line yields the 3‐ and 5‐year survival rates. The ROC curves showed that the two nomograms were superior to the other variables in predictive accuracy.
