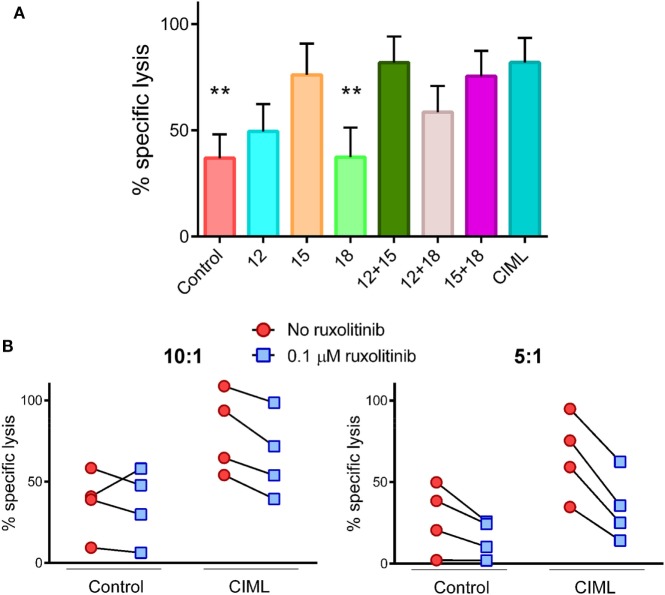
Figure 2.
Cytotoxicity of cytokine preactivated natural killer (NK) cells at the end of the preactivation phase. (A) Bar graph showing the specific lysis of K562 target cells by control non-preactivated and cytokine preactivated NK cells at 10:1 E:T ratio (n = 4). The bar graph shows the mean with SEM. Differences between cytokine-induced memory-like (CIML) NK cells and the rest of conditions were established with Friedman test. (B) Dot plot graphs showing the specific lysis of K562 target cells by control non-preactivated and CIML NK cells exposed or not to 0.1 µM ruxolitinib at 10:1 (left) and 5:1 (right) E:T ratios (n = 4). **p < 0.01.

