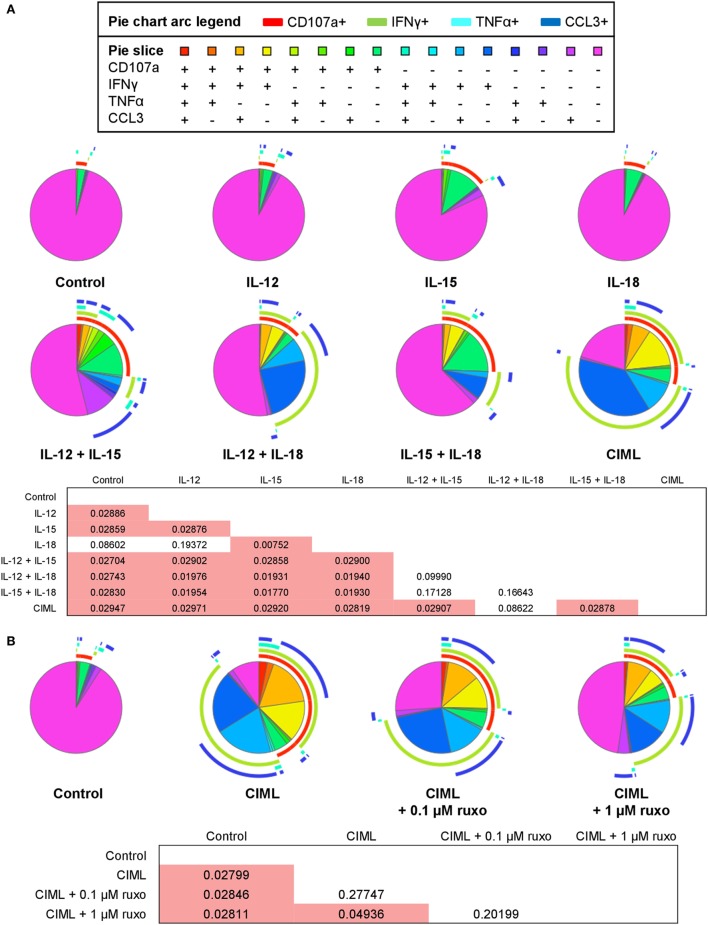
Figure 3.
Polyfunctionality of cytokine preactivated natural killer (NK) cells after the preactivation phase. (A) Pie charts representing the percentages of control non-preactivated and cytokine preactivated NK cells expressing CD107a, interferon (IFN)γ, tumor necrosis factor (TNF)α, and/or C-C motif chemokine ligand (CCL)3 (n = 4). (B) Pie charts representing the percentages of control non-preactivated and cytokine-induced memory-like (CIML) NK cells, and CIML NK cells preactivated in the presence of 0.1 and 1 µM ruxolitinib, expressing CD107a, IFNγ, TNFα, and/or CCL3 (n = 4). Differences between pie charts were established with non-parametric permutation test. The p-values are in the boxes below the pie charts. Significant differences are in the red cells.

