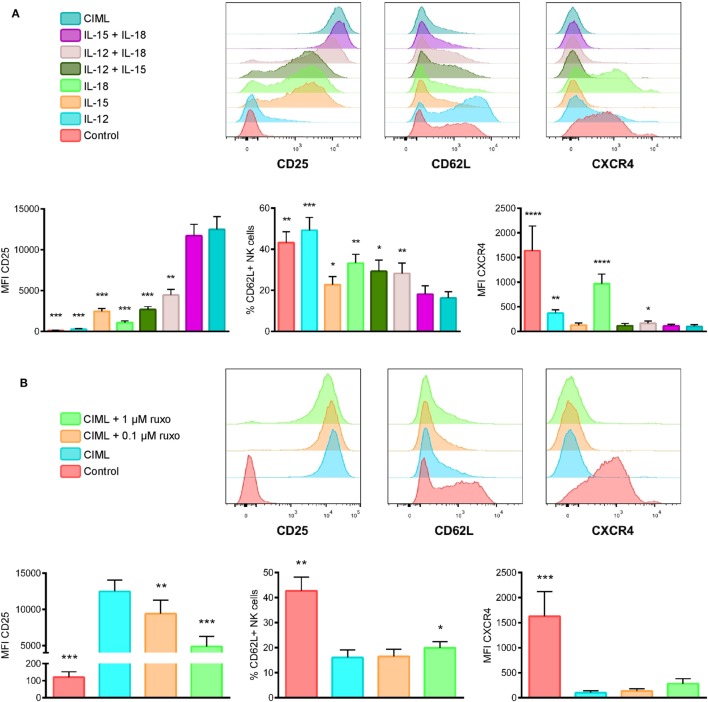
Figure 4.
Phenotype of cytokine preactivated natural killer (NK) cells after the preactivation phase. (A) Representative experiment (top) and bar graphs (bottom) showing the expression of CD25, CD62L, and CXCR4 on control non-preactivated and cytokine preactivated NK cells (n = 8). (B) A representative experiment (top) and bar graphs (bottom) showing the expression of CD25, CD62L and CXCR4 on control non-preactivated and cytokine-induced memory-like (CIML) NK cells, and CIML NK cells preactivated in the presence of 0.1 and 1 µM ruxolitinib (n = 8). The bar graphs show the mean with SEM. Differences between CIML NK cells and the rest of conditions were established with RM one-way ANOVA with the Greenhouse-Geisser correction (for normally distributed data) or Friedman test (for non-normal distributed data). *p < 0.05, **p < 0.01, ***p < 0.001, ****p < 0.0001.

