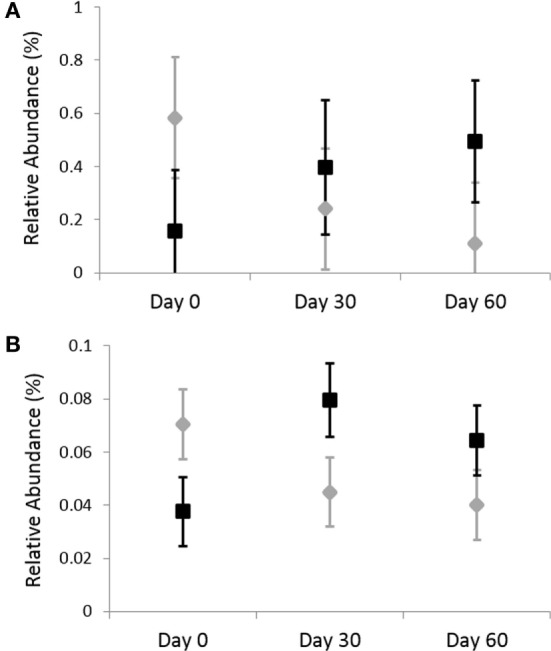
Figure 3.

Relative abundances of fecal bacterial microbiota by species. Data are presented for day 0 (baseline), day 30 (after 4 weeks of treatment), and day 60 (after 8 weeks of treatment) of placebo (250 mg lactose PO q 12 h, gray diamonds) and omeprazole (5 mg omeprazole PO q 12 h, black squares) administration. Error bars represent SEM. Notice that the y-axis is in a different scale for each bacterial group. (A) Clostridium perfringens and (B) Clostridium hiranonis.
