. 2018 Jan 23;9(9):2525–2532. doi: 10.1039/c7sc05312f

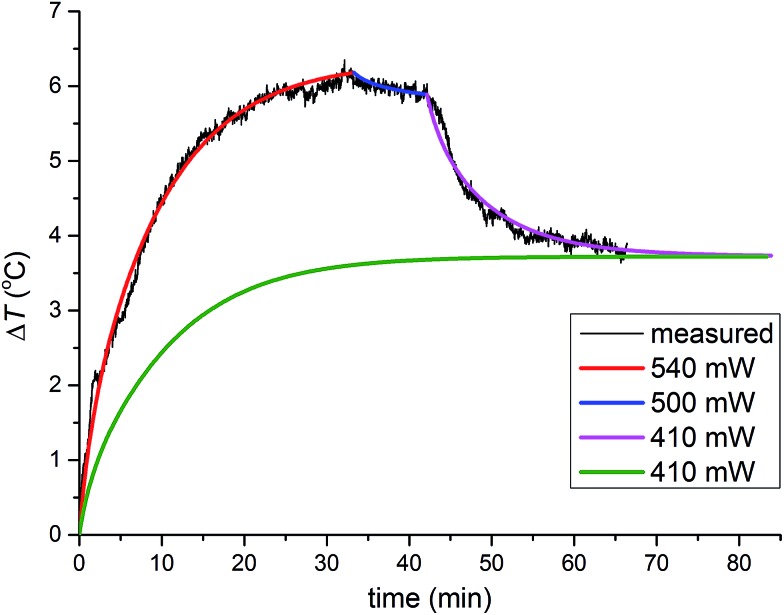
Fig. 3. Numerical modelling of temperature profiles. Three-stages of the reaction: formation of ZIF-8, its amorphisation and finally, recrystallisation of the amorphous matrix into the kat phase are depicted with red, blue and purple curves, respectively (from Fig. 2a). The heat flow rate (in milliwatts) is divided into sections where each section corresponds to a specific reaction mixture composition. After recrystallisation to the kat phase, the heat flow rate dropped from 500 mW to 410 mW. In a hypothetical milling experiment using identical ambient conditions, the same steady-state temperature was reached by using heat flow rate of 410 mW from the beginning (green curve).

Fig. 3