. 2018 Feb 12;9(10):2740–2749. doi: 10.1039/c7sc04761d

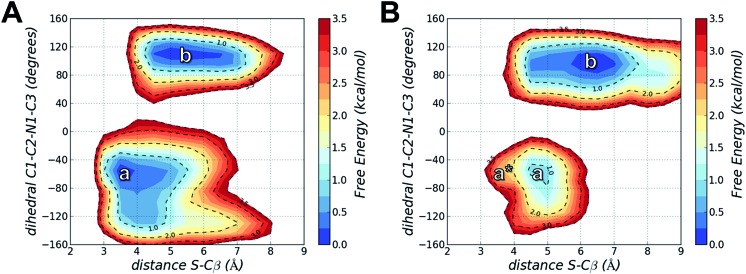
Fig. 5. Free energy surfaces calculated from the frequency distribution of conformations obtained from four independent 300 ns MD simulations of EGFR T790M (panel A) and EGFR T790M/L718Q (panel B) in non-covalent complex with osimertinib. a and b identify two conformational basins in the space of S–Cβ distance and C1–C2–N1–C3 dihedral angle; a* represents, in panel B, the region of reactive conformations for EGFR T790M/L718Q–osimertinib (which approximately corresponding to basin a in A). Free energies are given in kcal mol–1, the contour levels are set at 0.25 kcal mol–1 while dashed-contour lines are set every 1 kcal mol–1 with an additional line at 3.5 kcal mol–1.

Fig. 5