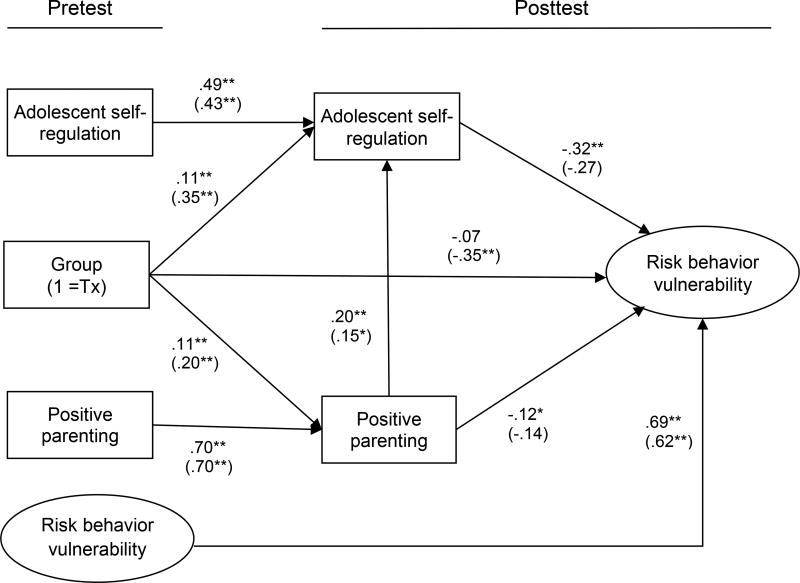
Figure 3.
ITT and CACE analyses of SAAF program theory; χ2 = 177.25, df = 69, p = .00, CFI=.94, and RMSEA = .05. Values presented are standardized parameter estimates. Economic hardship, male gender, SES, and single-parent family structure are controlled. N = 465. Parameters in parentheses are for the CACE model.
*p ≤ .05. **p ≤ .01.

